Schaeffer Center White Paper Series | DOI: 10.25549/sy3t-va20
Cite: (.enw, .ris)
Summary
Research and development (R&D)-focused tax policies and broader corporate tax policies influence incentives for innovation. In this paper, we review the empirical evidence on the effects of various corporate tax policies on innovation. Conceptually, R&D tax credits encourage R&D investments, and increases in the corporate tax rate or tax base discourage investments of many kinds, including R&D. In general, the literature supports these conceptual hypotheses, albeit with some nuance. R&D-focused tax policies boost R&D spending but appear to have much more limited effects on innovation output. This result is consistent with low-innovation firms “reclassifying” existing spending as R&D related to reduce their tax burden without meaningfully investing in innovation. In contrast, more general corporate tax cuts by national or regional governments tend to encourage firms to relocate innovation to the tax-cutting jurisdiction without impacting global innovation levels. Thus, general tax cuts work to attract innovation within a country’s or state’s borders, while R&D tax credits produce more limited effects on innovation even within the jurisdiction that offers them.
Key Takeaways
- Reductions in corporate income tax rates boost innovation productivity within a country’s borders.
- Corporate income tax reductions do not raise overall global innovation rates, suggesting that they draw innovation investment away from neighbors.
- Targeted R&D tax credits increase investments classified as research and development, but with mixed effects on innovation output.
- Targeted R&D credits are of less use to smaller, less profitable firms, and otherwise might encourage firms to reclassify existing investment as R&D related.
A press release covering this white paper’s findings is available here.
Policy Context
There is renewed interest in ensuring a robust biomedical sector in the U.S.: the Trump Administration has signaled interest in imposing tariffs on the pharmaceutical sector to shift investment domestically, and Congress now considers safeguarding the pharmaceutical supply chain to be a national security priority. This paper adds to that policy discussion by analyzing the effects of various corporate tax policies on biomedical innovation. Policymakers interested in increasing biomedical companies’ investments toward new technologies in the U.S. may benefit from the findings in this paper, which point to the following policy changes:
- Consider Corporate Income Tax Rate Reductions to Attract and Increase Innovation: Evidence suggests reductions in corporate income tax rates can boost innovation productivity (including the quantity and quality of patents and R&D personnel) within U.S. borders. These rate reductions do not appear to raise overall global innovation rates, but rather seem to draw innovation investment away from other countries or states.
- Recognize the Limitations of Targeted R&D Tax Credits: R&D-focused tax policies boost R&D spending but appear to have limited effects on innovation outputs. As currently structured, many firms reclassify existing spending as R&D, and smaller, less profitable firms (where a lot of innovation occurs) are unable to leverage these credits.
- Consider Complementary Non-Tax Policies, Especially for Startups: Highly innovative startup companies, often unprofitable in early stages, may not be meaningfully impacted by the traditional corporate tax policies. Consider non-tax incentives, such as direct government R&D appropriations or policies focused on increasing the supply of skilled R&D labor.
- Exercise Caution Regarding IP Boxes: The empirical evidence indicates that IP boxes primarily encourage the location shifting of patents and carry a significant risk of being used for profit shifting and tax base erosion. Careful design, potentially linking benefits to R&D expenditures conducted within the US (as recommended by OECD), is essential.
- Do Not Regard Cash Repatriation Incentives as a Primary Innovation Tool: Empirical evidence from policies like the American Jobs Creation Act (AJCA) and the 2017 Tax Cuts and Jobs Act (TCJA) indicates that tax incentives to repatriate foreign earnings do not lead to a significant increase in economy-wide R&D spending or overall innovation output.
- Recognize the Harms to Innovation from Anti-Tax Avoidance Policies: Anti-tax avoidance policies, such as addback statutes, are effective at their primary goal of reducing tax avoidance and preserving the tax base. However, these policies can have negative spillover effects on innovation, associated with a reduction in patents and patent citations.
Introduction
The United States spent $885 billion on research and development (R&D) in 2022, with the private sector accounting for 78% of R&D spending.[1] Tax policy influences a profit-maximizing firm’s decisions regarding how much to invest in innovation and how to allocate investments across various inputs of production. By influencing the returns on these private innovation investments, tax policy can influence innovation, which enables sustained economic growth and improved quality of life. Direct R&D tax subsidies, like R&D tax credits and immediate deductions for R&D costs, produce intuitive effects.[2] Each dollar spent on subsidies like these tends to yield up to $4 of extra R&D spending.[2] While R&D tax subsidies provide the most straightforward link between taxes and innovation, they may still introduce inefficient outcomes. For example, if firms simply reclassify existing spending as R&D, then taxpayer dollars have been spent without meaningfully financing innovation. Similarly, if innovation tends to occur in smaller, less profitable firms, they may not be able to take advantage of the tax credits. Beyond direct R&D incentives, the broader tax policy landscape influences innovative activities in a variety of ways. In this white paper, we review the conceptual relationship between corporate tax policies and innovative activity, along with associated empirical literature.
Conceptually, firms invest in labor and capital and in tax-avoidance activities like shifting work or intellectual property (IP) to low-tax areas.[3] They choose these investments to maximize the net present value of after-tax profits. Tax policies and rates often influence firms’ optimal investment allocations when tax incentives vary across spending categories.1 To see why, it helps to start with the extreme case of the “pure profit tax,” where the firm’s labor and capital costs are fully deductible and all the firm’s profits are subject to the same tax rate.[6] Economic theory implies that a pure profit tax has no effect on firm behavior. For an intuitive illustration, suppose the pure profit tax rate is 20% (i.e., firms keep 80 cents of every dollar of profit). In this thought experiment, firms are not incurring any tax-related costs on labor or capital investments and are keeping 80 cents of every dollar they earn as profit. None of their production or investment allocation decisions would change because the pure profit tax does not advantage or disadvantage any particular category of spending.
In the real world, however, not all revenue dollars are taxed at the same rate, and costs are not always fully deductible.[7] The unequal effects of taxation then create distortions that influence firms’ behavior in various ways. Choice of location is one example. If revenue earned in Ireland is taxed at a lower rate than revenue earned in the U.S., it is profit maximizing to shift more revenue generation to Ireland than would be optimal if the tax rates were the same.[8] While overall innovation levels may not be impacted by differential country-level tax rates if firms simply shift the location of their innovative activities, differential tax rates may introduce other inefficiencies, such as firms reallocating investment spending while incurring relocation costs. Taxes also depress investment in a similar manner. In the real world, wage expenditures are largely tax deductible, but capital investment costs are not fully deductible.[7] As a result, higher taxes impose more burdens on capital investment than on labor, and this differential burden encourages firms to pivot away from long-term capital investment. Regulations that target tax-avoidance behavior exacerbate this tendency and further reduce capital investment. Finally, tax incentives targeted at certain kinds of investment, like R&D, encourage spending on tax-favored categories by rewarding firms that distort their decisions in the favored direction.
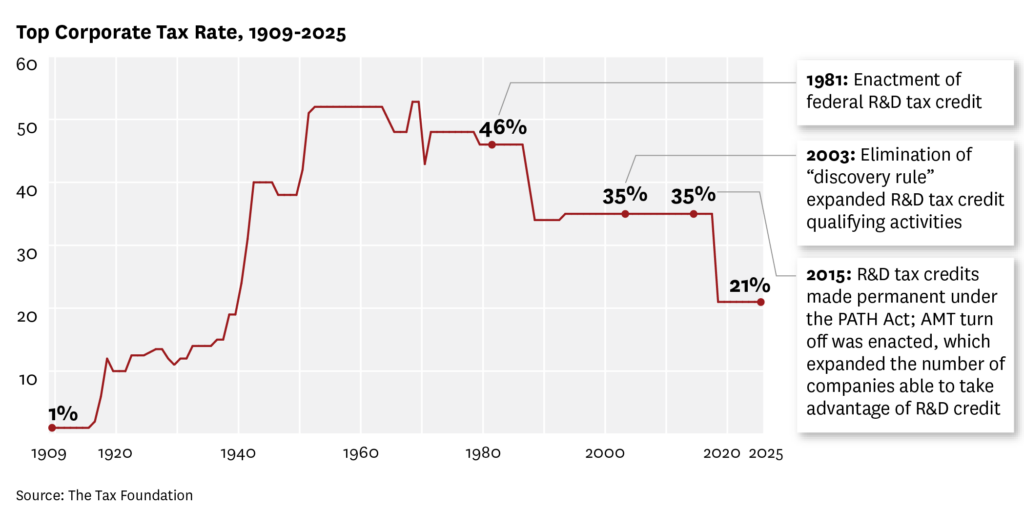
Major tax reforms, even those that are not explicitly intending it, may significantly influence innovation investments.2 The 2017 Tax Cuts and Jobs Act (TCJA) is a salient example.[9]The TCJA lowered the corporate income tax rate from 35% to 21%, the largest tax cut in American history, to improve alignment between U.S. corporate tax rates and those in other Organisation for Economic Co-operation and Development (OECD) countries.3 The TCJA also allowed full expensing of new capital investment, but that change is being gradually phased out, with full elimination of the benefit occurring in 2027. In addition, several TCJA provisions target R&D activities[11] by limiting the deductibility of R&D expenses and requiring firms to repatriate past profits out of lower-tax countries. The expected net effect of the TCJA is uncertain: While lower corporate tax rates should increase innovation (and overall investment), limiting R&D deductibility may mitigate or even reverse this effect in certain circumstances. Below, we further discuss the associated empirical evidence on its consequences for innovation.4
In this paper, we review the empirical evidence on the direction and magnitude of the effect that tax policies produce on innovation investments. We are primarily focused on the U.S. context and introduce international evidence to supplement gaps in the U.S.-based literature. The evidence reviewed in this paper suggests that corporate income tax reductions represent an effective way to encourage innovation in a jurisdiction. Tax breaks on R&D expenditures stimulate R&D expenditures but produce fewer tangible innovation gains. Our review focuses on recent empirical literature on U.S. corporate tax policy5 for a range of policy types that may affect innovation. Section 2a summarizes the empirical evidence on tax policies that directly target innovation, including R&D subsidies and IP boxes. We then consider tax policies that indirectly target innovation: Section 2b focuses on studies related to changes in corporate tax rates, and section 2c reviews studies of cash repatriation incentives. Section 2d summarizes studies related to anti-tax avoidance policies, which can have spillover effects on innovation. Finally, section 3 concludes by summarizing the implications of these policies for innovation and providing direction for future research.
2. Summary of Empirical Evidence on Corporate Tax Policies and Innovation
2.a Tax Policies Targeting Innovation
According to economic theory, reducing the corporate tax rate or enhancing the deductibility of investment costs (e.g., through depreciation or deductibility limits) should increase the optimal level of capital investment, corporate R&D expenditure and innovation output. Empirical studies largely support the first two predictions, of R&D spending and investment, although the evidence is mixed on the third.[7] Some evidence suggests that companies, especially in low-technology industries, respond by reclassifying existing investments as “R&D” related.
Tax breaks on R&D spending
In an early empirical study, Hall (1993) considers the impact of the Research and Experimentation Tax Credit (introduced in the Economic Recovery Tax Act of 1981), which lowered the after-tax cost of R&D by allowing private companies to apply a portion of R&D expenses against their federal income tax liability.[12] Hall estimates that for a firm with average investment rates, a 5% reduction in the average cost of conducting R&D after adjusting for tax rates and tax credits6 would increase R&D expenditure after two years by approximately 8% to 13%.[12] Other studies of this policy change confirm the direction of this effect. For instance, another study of U.S. firms across all industries finds that each dollar of the R&D tax credit results in $1.80 of new R&D spending.[13] In a more recent but smaller sample of firms, Klassen et al. (2004) estimate that each dollar of taxes foregone in the U.S. R&D tax credit system induces, on average, $2.96 of new R&D spending.[14]
Empirical evidence from ex-U.S. settings also suggests that R&D tax incentives achieve their intended effects on R&D spending. In a comprehensive study of nine OECD countries7 between 1979 and 1997, Bloom et al. (2002) examine the effects of introductions and modifications of rules governing R&D taxation on R&D spending over time. Bloom et al. (2002) estimate that a 10% fall in the cost of R&D due to changes in tax incentives leads to a 1% and nearly 10% increase in the level of short- and long-run R&D, respectively.[15] Agarwal et al. (2020) find that small private corporations in Canada increased their R&D expenditure by an average of 17% when they became eligible for a 35% R&D tax credit,8 relative to firms with similar taxable income but ineligible for the tax credit.[16] Finally, Guceri (2018) examines R&D tax-policy reform in the U.K. and estimates an 8.8% to 11.8% increase in R&D spending as a result of a 10% reduction in a firm’s cost of conducting R&D9 among medium-sized firms newly qualifying for a tax-relief scheme10 between 1999 and 2013.[17]
While R&D tax credits have the intended effect on R&D spending, they may not necessarily increase the quantity or quality of innovation, demonstrating the pitfalls of R&D-specific tax incentives versus broader tax reforms. For instance, Guceri et al. (2018) caution that an “increase” in R&D spending can be almost entirely attributed to relabeling ordinary employees or spending as R&D rather than increasing R&D levels.[17] In a related vein, a small meta-analysis conducted by Castellacci and Lie (2015) finds that R&D tax incentives generate larger responses in low-technology industries relative to high-technology industries,11 suggesting misallocation of government incentive dollars.[18] The authors speculate that low-technology firms may be more financially constrained and potentially more eager to spend resources qualifying for tax-credit schemes.[18] If this explanation is corroborated by future studies, R&D tax credits may not have meaningful effects on long-term innovation, despite their apparent effects on “R&D” spending. However, Dechezleprêtre et al. (2023) find that an expansion in eligibility for tax relief for small- and medium-sized enterprises in the U.K. results in a large and persistent increase in both R&D expenditures and the number of patents among newly eligible firms (direct effect) and non-recipient technologically related12 firms whose products rely on similar technologies as eligible firms (spillover effects).[20] More studies are required to evaluate whether the innovation-enhancing direct and spillover effects of tax credit schemes on innovation output is generalizable to a broader sample of firms or other countries, including the U.S.
Several studies considering cross-country variation in tax rates find that corporations shift their patent income to low-tax rate countries [21,22], but these shifts may have little or no impact on global R&D output. The impact of tax incentives on the quality of innovation is similarly unclear. For instance, Ernst et al. (2014) find that generous R&D tax credits and tax allowances exert a negative impact on project quality.[23]
Finally, R&D tax credits—a public subsidy—may have spillover effects on private R&D investment, although the expected direction of the effect is ambiguous. On one hand, R&D tax credits may “crowd out” privately financed R&D if they are awarded to large, financially unconstrained firms that would have performed the same level of private R&D even in the absence of the tax credit.[24] In this case, tax credits would not increase aggregate innovation investment or output. On the other hand, R&D tax credits may complement private R&D spending of incumbent firms and encourage small, financially constrained innovator firms to enter the market. In this case, we expect aggregate innovation investment and output to increase. Empirical research offers results supporting both mechanisms, although a slight majority of studies13[25] as well as more recent studies[26] report that public and private R&D are complementary. In other words, R&D tax credits stimulate private R&D spending on net, rather than crowding it out.
Tax breaks on innovation-related income
IP boxes are another form of tax incentive that aims to stimulate innovation. Unlike R&D tax credits, which provide tax breaks on R&D spending, IP boxes reduce taxes on income that results from IP.[27]14 IP boxes have been adopted in 18 European countries but are not part of the current U.S. tax code.[28] In a survey of tax directors for 200 companies that belong to the Biotechnology Industry Organization (BIO), 20% of respondents said that IP box policies in other countries have caused them to relocate patents, and 7% said they had moved manufacturing abroad.[29] Moreover, approximately 57% said they would probably retain more R&D and/or IP in the U.S. if it adopted a patent box with a 10% tax rate for attributable income.[29]15
Empirical evidence based on IP-box policies in Europe indicates that IP boxes lead to location shifting of patents. In a policy simulation, Griffith et al. (2014) show that the introduction of IP box policies in Belgium, the Netherlands and Luxembourg results in the share of new patent applications increasing in these countries by 48% to 84%.21 Similarly, Alstadsæter et al. (2018) find that for each percentage point increase in the tax advantage resulting from an IP box, the number of patents in the country with an IP box will increase by 9% to 17%.[30] High-value patents are especially sensitive to tax advantages.16 However, Ohrn (2016) shows that the specific characteristics of IP-box policies can drastically alter the effect on innovation.[31] For example, he finds that an IP box that applies to new IP increases foreign R&D by 46% to 48%, but an IP box that applies to all IP (new and existing/acquired) will decrease foreign R&D by 10% to 22%. The second result likely arises because creating new IP is costlier than using existing IP and because existing IP may be an imperfect substitute for new IP. Consequently, providing tax breaks for both new and existing IP inadvertently discourages companies from developing new IP, and instead encourages them to rely on existing IP instead.
Echoing concerns raised by the European Union, the OECD flagged IP boxes being used as a tool for profit shifting, which can result in tax-base erosion in countries with relatively high effective tax rates.17 Although base erosion and profit shifting affects all countries, it has a larger impact on developing economies, which tend to rely more heavily on corporate taxes.[32] As a result of these concerns, OECD countries agreed that IP-box policies require a link between R&D expenditures, IP assets and IP income. This limitation implies that firms located in Country X can only take advantage of an IP-box policy in Country Z if its R&D expenses occur within Country Z.
2.b Corporate Tax Rates and Innovation
A handful of researchers has studied the effect of corporate income taxes on various outcomes including investment, firm location decisions, employment and GDP growth. We are aware of four studies that specifically consider the impact of corporate income taxes on innovation inputs (i.e., R&D expenditure) and outputs (i.e., patents, patent citations and new product introductions) in the U.S.
At the federal level, Kalcheva et al. (2020) examined the impact of the TCJA on R&D spending. As mentioned earlier, TCJA has countervailing effects on R&D spending because it both lowers tax rates and limits the deductibility of R&D spending. On net, Kalcheva et al. find that it reduces R&D spending, albeit modestly, by 0.5 to 3.8 percentage points18[11], suggesting that the deductibility effects outweighed the effects of the corporate rate cut.19 Cloyne et al. (2024) calibrate a model using federal corporate tax changes from 1950 to 2019 and find R&D expenditures have a substantial initial response to a 1% decrease in corporate income taxes.[35] The peak increase in R&D spending (1.1%) occurs four years after the tax decrease, then reverts to zero after 10 years. In addition to R&D expenditures, total patents, trademark assignments and other non-R&D IP purchases all increase in response to lower corporate income taxes.
Three studies have examined changes in state-level corporate taxes, which are not confounded with changes in other tax incentives. Using state-level tax cuts between 1988 and 2006, Atanassov and Liu (2020) find that cuts in state corporate income taxes increase the quantity and quality of innovation (measured by number of patents and number of patent citations, respectively).[36] Firms in states with tax cuts report 0.63–0.79 more patents, which corresponds to approximately 1.2% and 1.4% of the observed variation in the number of patents20 between 1988 and 2006. Firms in states with tax cuts receive 0.75 more citations per patent, which corresponds to approximately 5.4% of the observed variation in citations per patent21 between 1988 and 2006. Mukherjee et al. (2017) examine the impact of state corporate tax changes over a similar period (1990–2006).[37] They find that tax increases are accompanied by a 4.3% decline in R&D expenditures and a 5.1% decrease in new product introductions. This provides clear evidence that higher tax rates discourage innovation output.
Akcigit et al. (2022) find that the share of patents produced by firms, as opposed to individual inventors, rises when corporate tax rates fall. In particular, among corporate inventors, a 1% increase in the corporate tax rate leads to 0.49 fewer patents per corporate inventor.22 Patent quality, measured as average citations per patent, remains unchanged. [8] Geographic variation in corporate tax rates also results in corporate inventors changing locations to areas with lower corporate tax rates.23 Moretti and Wilson (2017) find that lower U.S. state-level corporate tax rates attract key R&D personnel (high-earning scientists) and thus may improve the quality of innovation within a low-tax haven.[38] Dudar and Voget (2016) estimate patent location choice elasticities with respect to differential tax rates across countries.[39] They find when a country increases the tax rate on royalty income from patents by 1%, the number of patents created within the country decreases by 0.05% to 0.85%. Furthermore, the number of patents increases in other countries (holding their tax rates constant) by up to 0.39%, suggesting the presence of patent shifting. In a U.S. context, a 1% increase in the tax rate decreases U.S.-based patents by 0.6% and increases patents in other countries by 0.16% to 0.39%. Similarly, in a sample of European multinational companies, Dischinger and Riedel (2017) find that a 1% decrease in the average tax differential between a subsidiary’s tax rate and that of other affiliates raises that subsidiary’s intangible property investment by 1.7% on average.[40]
Corporate tax rates can also influence innovation indirectly by modifying a firm’s willingness to invest in “risky” projects (i.e., projects with a lower probability of success), which may be more likely to increase innovation relative to existing “safe” (i.e., low-risk) projects. Higher tax rates reduce expected profits more for risky projects than for low-risk projects because taxes reduce the rewards from success but do not change the cost of project failure.[41] Moreover, tax cuts can decrease a firm’s reliance on costly external financing for projects,[36] thereby increasing their willingness to invest in risky projects.[42] For incumbent firms, tax rates may also alter managerial incentives to invest in risky projects because greater after-tax profits can strengthen managers’ willingness to take on risk and suppress incentives to shirk effort.[36]
Current empirical evidence suggests a weakly negative impact of tax rates on firm risk taking. However, these effects are conditional on other tax incentives24 simultaneously affecting firm-level decisions[43,44] and may be asymmetric (i.e., higher tax rates decrease risk taking but tax cuts do not have any effect).[41,44] Finally, tax rates may also influence an entrepreneur’s decision to enter a market and increase the number of entrepreneurs, thus increasing aggregate innovation.25 Limited empirical evidence suggests that the entry of new firms declines in response to higher corporate tax rates[46] but the impact on innovation output is unclear.
2.c Tax Incentives to Repatriate Cash
Two recent federal U.S. tax bills, the American Jobs Creation Act (AJCA) and the TCJA, reduced the cost of repatriating cash. Passed in 2004, the AJCA promoted domestic investment and employment by offering a one-time deduction of 85% on repatriated foreign earnings. In addition to lowering the corporate tax rate, the TCJA increased firms’ internal liquidity by reducing the cost of repatriating cash accumulated in foreign subsidiaries. Even though both the AJCA and TCJA incentivized repatriation, the AJCA made repatriation optional, but the TCJA made it mandatory and taxed assets at higher rates compared with the AJCA.[11]26
Conceptually, repatriated earnings create financial slack for firms and allow them to engage in more investment, including innovation. At the economywide level, however, there is little evidence that repatriation increases innovation spending or output. Almeida et al. (2021) find that firms did not change their R&D spending or intangible assets in response to the financial slack created by the AJCA.[47] Moreover, the AJCA decreased patent value by 20%.27 Similarly, Dharmapala (2011) finds that the AJCA did not meaningfully change R&D spend.[48] Albertus et al. (2024) find that U.S. firms experiencing a TCJA-liquidity shock do not appear to adjust either their domestic or foreign R&D expenditures.[49]28 These findings suggest that taxing earned profits may not be distortionary for innovation as long as firms are not liquidity constrained.
However, the broader literature indirectly suggests that effects may be centered in R&D-intensive industries. For instance, several academic studies find that, within the pharmaceutical industry, greater liquidity increases R&D expenditure,[50] R&D output[51] and R&D quality.[51] The evidence on liquidity and R&D expenditure demonstrates an effect for transient, short-term increases in liquidity, which are conceptually similar to the effects created by tax-related repatriation incentives. In addition, the literature finds that increases in pharmaceutical firm net worth lead to more and better innovation investments. Repatriation incentives, rate cuts and other tax-related incentives can be expected to increase net worth. While these papers do not specifically study the effect of tax incentive-linked increases in liquidity and net worth, they suggest the need for further research on tax policy and the effects on R&D-intensive industries in particular.
2.d Anti-tax Avoidance Policy Spillovers on Innovation
Anti-tax avoidance policies may reduce innovation by raising the effective corporate tax rate and thus discouraging innovation investment. Add-back statutes aim to deter firms from “income shifting” or moving intangible assets from high- to low-tax areas. In particular, they require firms to add back their federal (state) taxable income intangible-related expenses paid to related parties (e.g., subsidiaries) in other countries (states). Conceptually, we expect add-back statutes to reduce innovation because they increase the cost of using intangible assets to engage in tax-avoidance activities, decreasing the expected value of innovation. However, in practice, the effect of add-back statutes depends on the number and nature of exceptions allowed in statutes and the degree to which the statutes are enforced.[52]
Li et al. (2021) find that state-level add-back statutes reduce the number of patents by 4.77% and the number of patent citations by 5.12%.[52] Along the same lines, Skeie et al. (2017) find that patent applications by multinational enterprises increase when preferential tax rates for patent income fall.[53] They also find that the interaction between corporate tax rates on patent income and anti-avoidance rules29 plays an important role. In particular, a firm located in a country with relatively high tax rates and strong anti-avoidance statutes tends to have more “non-shifted” patents (i.e., patents where the inventor and the patent are located in the same country) compared to a similar firm located in a country with similar tax rates but less strict anti-avoidance laws.
Conclusion
This paper highlights the effects of corporate tax policy on innovation and summarizes findings from the empirical literature, with a focus on the United States. The existing literature generally shows that direct front-end policies such as R&D tax incentives have the intended effect on investment, although we cannot rule out firms relabeling investment as R&D without meaningfully increasing R&D. In contrast, IP boxes, which represent a back-end policy, have more modest impacts on R&D spending, but appear to modestly increase R&D output in the form of patents or patent citations. More generally, while IP boxes provide a means to incentivize innovation, the distortions created may outweigh their benefits. IP boxes in their current form may be even less effective at stimulating innovation than R&D credits, in part because they reduce tax burden by a smaller amount.[55,56] Moreover, IP boxes only target income from successful innovation, which overlooks the potential knowledge spillovers from research that fails or is not commercialized. They also disincentivize innovation that is not inherently patentable, such as basic research. Finally, the empirical research we summarized on IP boxes used data prior to countries implementing OECD requirements for IP boxes; studies using more recent data will help us understand the impact of the most current IP-box policies on innovation.
Changes in corporate tax rates also indirectly target innovation and, similar to IP boxes, have more modest impacts on R&D spending, but they do appear to increase R&D output in the form of patents or patent citations. More research is needed to understand whether gains in innovation offset revenue losses from rate cuts. The global effects of jurisdictional tax cuts, however, remain unclear, because some of the increases in output within a tax-cutting jurisdiction may arise because of innovators that relocate from higher tax jurisdictions.30 Indeed, these policies seem to induce firms to relocate IP locations and/or R&D activities—increasing patents in relatively low-tax areas—without changing total innovation at the aggregate level. This point is particularly salient for IP-box policies, which are not uniformly adopted across countries.
In contrast, we lack empirical evidence to support the hypothesis that repatriation incentives increase innovation, even though, conceptually, liquidity should allow firms to invest in more R&D activity. The evidence suggests that firms are not generally liquidity constrained for innovation spending and promoting innovation is not a strong justification for repatriation incentives.
Finally, anti-tax avoidance policies have their intended effect, although they aim to increase tax burden, which decreases innovation. Along with R&D credits, these policies highlight the need to understand the trade-offs between tax revenue and incentivizing innovation. R&D credits that result in the reclassification of existing spending represent a loss of public tax dollars that could be used for other policies to promote economic growth or quality-of-life improvements. State-level policies designed to limit tax avoidance mitigate revenue losses but also reduce spending on innovation.
The hypothesis that companies adjust their innovation efforts in response to corporate tax policies assumes companies are profitable enough to be meaningfully impacted by changes in tax rates or other specific policies. However, startup companies, which are more likely to have major innovations (i.e., “blockbusters”) compared with larger incumbent firms[58–60], are less likely to be profitable and therefore have low (or no) tax burden. Thus, to encourage innovation among companies that may not be meaningfully impacted by tax rates, policymakers should consider non-tax incentives aimed at nascent industries or relatively new firms.
Fiscal policy, supply side policies and income taxes can also play a role in innovation but are outside the scope of this review. For example, government appropriations for agencies conducting R&D may generate spillovers to private sector R&D.[61,62] Separately, policies aimed at increasing the supply and/or quality of R&D workers—such as reducing barriers to education,31 incentivizing and expanding enrollment in STEM programs, or relaxing immigration quotas for high-skilled workers—will reduce the cost of R&D even without changing corporate tax policy.[63,64] Finally, while income taxes can influence high-skilled employee location preferences, which impacts the ability of firms to attract workers, empirical evidence suggests they have a larger impact on individual innovators.[65]
The majority of empirical research summarized in this paper quantified innovation output using patents or patent citations. These metrics are convenient because they provide a comparable output measure across disparate industries. For example, we cannot compare the number of new drugs in the pharmaceutical industry to more efficient computer chips in the semiconductor industry. Understanding the impact of tax policy on specific industries is important, but pooling all industries provides insights into broader economic impact. To shed light on the industry-specific impacts of R&D tax incentives on innovation rather than investments in innovation, future empirical work should consider innovation outputs that are salient for each industry (e.g., drug approvals in the pharmaceutical sector).
Even though R&D tax incentives increase innovation investment, evidence suggests that they may also get absorbed by low-innovation industries, resulting in reduced economic efficiency. For example, Eskandari and Zamanian (2023) find that large firms increase their investment more than small firms in response to decreases in corporate tax rates.[66] Whether heterogeneous responses generalize to innovation investment or innovation outcomes is unknown. Future research should stratify analyses by industry, firm size or degree of innovation to understand heterogeneity in policy impact and whether policy effects in the overall economy are dampened by firms with relatively low innovation activity. Finally, the handful of studies examining the impact of the TCJA on innovation suggests that its effects have been modest. These studies were largely published in the first few years following the TCJA implementation. However, investment and innovation activities can take time for firms to implement, and there may also be long lags for innovations to appear in data. Thus, existing research related to firm response to the TCJA may not capture its full economic impact, and updated studies that incorporate longer-run data are needed.
Appendix
Footnotes
1 We point readers interested in a more comprehensive theoretical framework of how tax policy affects firm decisions to Graham (2013) and Auerbach and Hines (2002).[4,5]
2 A full accounting of all historic tax changes in the U.S. is outside the scope of this paper. A figure with historic U.S. corporate tax rates and key events related to the R&D tax credit overlayed is provided in the appendix.
3 Global tax policy and reform is outside the scope of this review, although we reference it as needed depending on the availability of studies with U.S. data. Gomez-Cram and Olbert (2023) provide an overview of recent developments in global tax reform and the expected effect on companies. [10]
4 Most of these studies have relied on data from the first few years following TCJA implementation; additional research that uses long-run data will be required to understand the full economic impact of the TCJA.
5 We supplement our review with empirical evidence from the ex-U.S. context for innovation-related outcomes only when U.S.-specific empirical evidence is dated (e.g., analyses based on data prior to the year 2000), where U.S. tax policy is compared to other countries in cross-country analyses or if U.S.-specific empirical evidence is not available.
6 This is referred to as the “tax price of R&D.” Note that if R&D is expensed as incurred and no tax credits are available, the after-tax price of R&D is defined as (1 – corporate tax rate).
7 France, Italy, Canada, U.K., U.S., Germany, Japan, Australia.
8 This was the result of the change in eligibility rules for Canada’s Scientific Research and Experimental Development tax-incentive program in 2004. Small firms are defined as those with prior-year taxable income between C$200k and C$500k.
9 The cost of conducting R&D refers to the value of a dollar spent on R&D net of taxes and deductions applicable to R&D expenses.
10 Medium-sized firms with more than 250 and fewer than 500 employees experienced a reduction in tax burden as a result of a change in eligibility rules for a small-medium enterprise (SME) tax-relief scheme in the U.K. Prior to 2008, firms with fewer than 250 employees qualified for the SME tax-relief scheme. From 2008, the eligibility rules were expanded to include firms with fewer than 500 employees.
11 The distinction between “high-” and “low-” technology firms varies across reviewed studies. The “high-technology” industries considered in reviewed empirical studies include pharmaceuticals, software and manufacturing of electronic components. “Low-technology” industries include manufacturing firms not engaged in the production of electronic components.
12The authors consider two firms to be “technologically related” if (i) most of their patents are in the same technology class (using three-digit class definitions from the International Patent Classification system), and (ii) the value of technological distance (i.e., a measure developed by Jaffe (1986)) between them is above 0.75 (the median among all firm pairs sharing the same primary technology class).[19,20] It should be noted that “technologically related” firms may not be competitors because highly similar technologies may have different applications and, thus, cater to non-overlapping markets.
13 In a comprehensive review of the empirical literature on the relationship between private and public R&D, approximately 60% of the 77 studies (comprising 118 evaluations) reviewed report that public subsidies are complementary.[25]
14 IP boxes can apply to either gross or net income. The preferential tax rates for gross income IP boxes apply to IP revenues, whereas net-income IP boxes only apply the preferential rate to IP revenue net of IP costs.
15 The authors note that many firms in BIO are small and unprofitable, which implies that they would not be impacted by patent boxes.
16High-value patents are defined as patents belonging to the top quartile in terms of patent family group size, where family groups indicate whether a given patent registration corresponds to the same priority and invention.
17 The OECD points out that while most tax-base erosion and profit-shifting (BEPS) activities are not illegal, they undermine the fairness and integrity of tax systems. Because larger multinational corporations are more likely to be able to take advantage of BEPS practices, they are better able to avoid income taxes, implicitly shifting the burden onto other tax-paying entities.
18 For a firm with an average R&D spend, this implies a 0.2% to 1.5% decrease in R&D spend.
19 Prior to the TCJA, the after-tax cost of $1 of R&D was $0.79 (assuming a tax rate of 21%), but the deductibility changes from the TCJA imply that $1 of R&D will cost more than $0.79. [33,34]
20 An increase of 0.63–0.79 patents corresponds to approximately 1.2% and 1.4% of one standard deviation (54.99 patents) above the mean (5.9 patents) in the distribution of the number of patents between 1988 and 2006, respectively.
21 An increase of 0.75 citations per patent corresponds to approximately 5.4% of one standard deviation (13.81 citations) above the mean (3.9 citations) in the distribution of citations per patent between 1988 and 2006, respectively.
22 An inventor is defined as a corporate inventor in a given year if they have at least one patent assigned to a company over the next three years.
23 The effect of corporate mobility (across states) is more likely to be “zero sum” in the sense that it does not impact overall innovation when aggregated to the federal level.
24 For example, Ljungquist examines changes in corporate tax rates in the presence of tax loss carrybacks, and finds that the tax rate has a positive effect on risk taking for firms that expect to use losses and a weak negative effect for those that cannot.[41]
25 Relative differences in corporate and income tax rates may also affect firm decision-making. In particular, C corporations pay corporate taxes and may also face personal taxes if they distribute dividends, whereas profits from S corporations are passed through to owners who then pay income taxes. One study examined the effect of a tax exemption for pass-through income and found evidence of increased effort from activities compensated by business income as well as income recharacterization (from wages to contractor from the same employer).[45]
26 The TCJA taxed repatriated liquid and illiquid assets at 15.5% and 8%, respectively, whereas the AJCA taxed all repatriated assets at 5.25%.
27 Patent value is defined as a firm’s stock price reaction around its patent grant announcement date, which proxies for the market value of patents to shareholders. However, there is some evidence that firms engaged in more “exploratory” innovation—measured by exploratory, unknown, failed and breakthrough patents—in response to financial slack. The AJCA increased exploratory, unknown, failed and breakthrough patents by 7.2, 3.6, 4.2, and 0.9 percentage points, respectively.
28 Similarly, firms’ capital expenditure, wage expense, or mergers and acquisitions do not significantly change.
29 In particular, the authors classify the strength of a country’s anti-avoidance statues based on transfer pricing rules and withholding taxes, which are a subset of a broader classification presented in Johansson et al.[54]
30 Beyond firm relocation, changes in U.S. corporate tax policy will also have international spillover effects. In particular, when the U.S. reduces taxes, we generally expect increases in foreign output, consumption and investment.[57]
31 While higher education and graduate education in particular are often the focus of improving the quality and quantity of workers for R&D, improving education even at lower levels can have profound downstream effects.
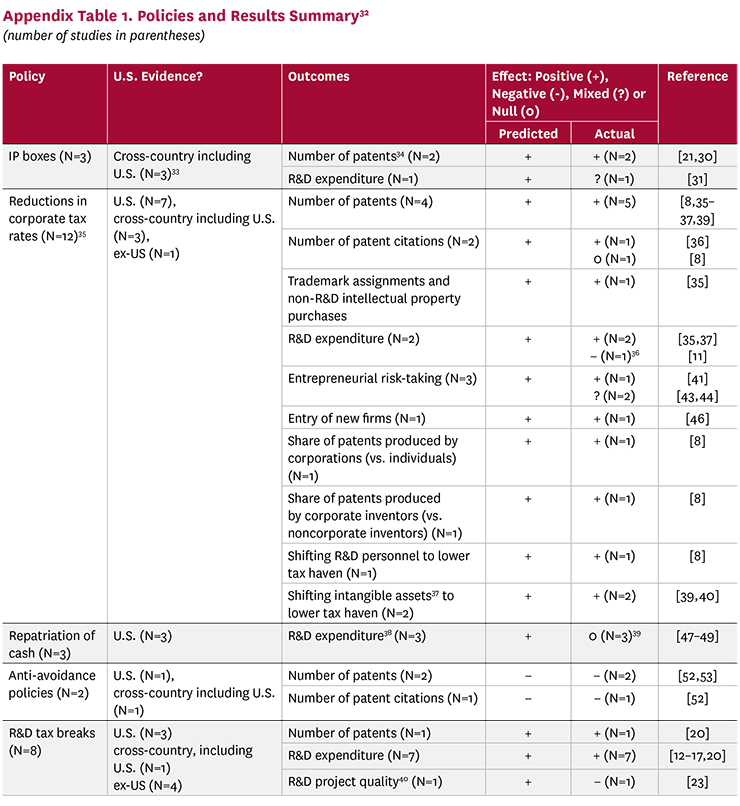
32 Meta-analyses and surveys of the empirical literature referenced in the paper are not included in the table. [18,25,26]
33 Includes data from foreign subsidiaries of U.S. multinational firms. There are no official IP/patent box regimes in the U.S. as of April 2025.
34 Includes number of patents and patent applications.
35 While some studies examine the effect of reductions in tax rates, others evaluate the effects of increases in tax rates. To facilitate comparisons across studies, we standardize the main effect to be interpreted with respect to a reduction in corporate tax rates.
36 Kalcheva et al. (2020) consider the lower tax rates as a result of the TCJA, which included various other provisions. The impact of lower tax rates on R&D expenditure may be confounded by additional TCJA provisions that limit the amount of R&D expenditure that is tax deductible.
37 Includes patents, trademarks, copyrights or other intangible assets. [39,40]
38 Includes domestic and foreign R&D and expenditure on intangible assets.
39 Albertus et al. (2024) consider changes in access to cash held in foreign subsidiaries of U.S. firms as a result of the TCJA. The authors control for the reduction in the U.S. corporate income tax rates that occurred as a part of the TCJA to isolate the effects of changes in incentives to repatriate cash. [49]
40 Project quality is a composite measure that relies on a patent’s forward citations, its family size and the number of technical fields. [23]
References
- National Science Board. (2024). Research and Development: U.S. Trends and International Comparisons. National Science Foundation. https://ncses.nsf.gov/pubs/nsb20246.
- Muresianu, A., and G. Watson. (2021). Reviewing the Federal Tax Treatment of Research & Development Expenses. Tax Foundation. https://taxfoundation.org/research/all/federal/research-and-development-tax.
- Dyreng, S. D., J. L. Hoopes and J. H. Wilde. (2016). Public Pressure and Corporate Tax Behavior. Journal of Accounting Research, 54 (1): 147–86.
- Graham, J. R. (2013). Do Taxes Affect Corporate Decisions? A Review. In Handbook of the Economics of Finance, vol. 2, edited by G. M. Constantinides R. M. Stulz and M. Harris, 123–210. Amsterdam: Elsevier.
- Auerbach, A. J., and J. R. Hines Jr. Taxation and Economic Efficiency. (2002). In Handbook of Public Economics, vol. 3, edited by, by M. Feldstein and A. J. Auerbach, 1347–421. Amsterdam: Elsevier.
- Diamond, P. A., and J. A. Mirrlees. (1971). Optimal Taxation and Public Production I: Production Efficiency. American Economic Review, 61 (1): 8–27.
- Jacob, M. (2022). Real Effects of Corporate Taxation: A Review. European Accounting Review, 31 (1): 269–96.
- Akcigit, U., J. Grigsby, T. Nicholas and S. Stantcheva. (2022). Taxation and Innovation in the Twentieth Century. Quarterly Journal of Economics, 137 (1): 329–85.
- Kennedy, P. J., C. Dobridge, P. Landefeld and J. Mortenson. (2024). The Efficiency-Equity Tradeoff of the Corporate Income Tax: Evidence from the Tax Cuts and Jobs Act. Unpublished manuscript. https://economics.yale.edu/sites/default/files/2023-01/The%20Efficiency-Equity%20Tradeoff%20of%20the%20Corporate%20Income%20Tax.pdf
- Gómez-Cram, R., and M. Olbert. (2023). Measuring the Expected Effects of the Global Tax Reform. Review of Financial Studies, 36 (12): 4965–5011.
- Kalcheva, I., J. M. Plečnik, H. Tran and J. Turkiela. (2020). (Un)intended Consequences? The Impact of the 2017 Tax Cuts and Jobs Act on Shareholder Wealth. Journal of Banking & Finance. 118: 105860.
- Hall, B. H. (1993). R&D Tax Policy during the 1980s: Success or Failure? Tax Policy and the Economy, 7: 1–35.
- Rao, N. (2016). Do Tax Credits Stimulate R&D Spending? The Effect of the R&D Tax Credit in Its First Decade. Journal of Public Economics 140: 1–12.
- Klassen, K. J., J. A. Pittman, M. P. Reed and S. Fortin. (2004). A Cross‐National Comparison of R&D Expenditure Decisions: Tax Incentives and Financial Constraints*. Contemporary Accounting Research, 21 (3): 639–80.
- Bloom, N., R. Griffith and J. Van Reenen. (2002). Do R&D Tax Credits Work? Evidence from a Panel of Countries 1979–1997. Journal of Public Economics, 85 (1): 1–31.
- Agrawal, A., C. Rosell and T. Simcoe. (2020). Tax Credits and Small Firm R&D Spending. American Economic Journal: Economic Policy, 12 (2): 1–21.
- Guceri, I. (2018). Will the Real R&D Employees Please Stand Up? Effects of Tax Breaks on Firm-Level Outcomes. International Tax and Public Finance, 25 (1): 1–63.
- Castellacci, F., and C. M. Lie. (2015). Do the Effects of R&D Tax Credits Vary Across Industries? A Meta-Regression Analysis. Research Policy, 44 (4): 819–32.
- Jaffe A. B. (1986). Technological Opportunity and Spillovers of R&D: Evidence from Firms’ Patents, Profits and Market Value. American Economic Review, 76 (5): 984–1001.
- Dechezleprêtre, A., E. Einiö, R. Martin R, K. T. Nguyen and J. Van Reenen. (2023). Do Tax Incentives Increase Firm Innovation? An RD Design for R&D, Patents and Spillovers. American Economic Journal: Economic Policy, 15 (4): 486–521.
- Griffith, R., H. Miller and M. O’Connell. (2014). Ownership of Intellectual Property and Corporate Taxation. Journal of Public Economics, 1 (112): 12–23.
- Boehm, T., T. Karkinsky and N. Riedel. (2015). The Impact of Corporate Taxes on R&D and Patent Holdings. SBS Conference Paper. https://epitest.nhh.no/globalassets/departments/business-and-management-science/seminars/2015-spring/190215.pdf.
- Ernst, C., K. Richter and N. Riedel. (2014). Corporate Taxation and the Quality of Research and Development. International Tax and Public Finance, 21 (4): 694–719.
- Paff, L. A. (2005). State-Level R&D Tax Credits: A Firm-Level Analysis. BE Journal of Economic Analysis & Policy, 5 (1): 0000101515153806531272.
- Zúñiga-Vicente J. Á., C. Alonso-Borrego, F. J. Forcadell and J. I. Galán. (2014). Assessing the Effect of Public Subsidies on Firm R&d Investment: A Survey. Journal of Economic Surveys, 28 (1): 36–67.
- Becker, B. (2015). Public R&D Policies and Private R&D Investment: A Survey of the Empirical Evidence. Journal of Economic Surveys, 29 (5): 917–42.
- Tax Foundation. (2024). What Is a Patent Box? https://taxfoundation.org/taxedu/glossary/patent-box.
- Sara, I., and A. Mengden. (2024). Patent Box Regimes in Europe, 2024. Tax Foundation. https://taxfoundation.org/data/all/eu/patent-box-regimes-europe-2024.
- Brannon, I., and M. Hanlon. (2015). How a Patent Box Would Affect the U.S. Biopharmaceutical Sector. Tax Notes. https://www.taxnotes.com/tax-notes-today-international/corporate-taxation/how-patent-box-would-affect-us-biopharmaceutical-sector/2015/02/03/gzjd.
- Alstadsæter, A., S. Barrios, G. Nicodeme, A. M. Skonieczna and A. Vezzani. (2018). Patent Boxes Design, Patents Location and Local R&D. Economic Policy, 33 (93): 131–77.
- Ohrn, E. (2016). The Effect of IP Box Regimes on International IP Payments and Foreign Research and Development. International Tax Policy Forum. https://itpf.org/itpf-research/itpf-sponsored-research/items/the-effect-of-ip-box-regimes-on-international-ip-payments-and-foreign-research-and-development.
- OECD. (2024). Base Erosion and Profit Shifting (BEPS). https://www.oecd.org/en/topics/base-erosion-and-profit-shifting-beps.html#key-messages.
- Bellafiore, R. (2019). Amortizing Research and Development Expenses Under the Tax Cuts and Jobs Act. Tax Foundation. https://taxfoundation.org/research/all/federal/research-development-expensing-tcja.
- Stanford Report. (2024). The Tax Code Oversight Causing Innovation to Falter. https://news.stanford.edu/stories/2024/10/american-innovation-got-slammed-temporary-end-key-tax-incentive.
- Cloyne, J., J. Martinez, H. Mumtaz and P. Surico. (2025). Corporate Taxes, Innovation and Productivity (working paper). https://www.josebamartinez.com/pdf/CMMS.pdf.
- Atanassov, J., and X. Liu. (2020). Can Corporate Income Tax Cuts Stimulate Innovation? Journal of Financial and Quantitative Analysis, 55 (5): 1415–65.
- Mukherjee, A., M. Singh and A. Žaldokas. (2017). Do Corporate Taxes Hinder Innovation? Journal of Financial Economics, 124 (1): 195–221.
- Moretti, E., and D. J. Wilson. (2017). The Effect of State Taxes on the Geographical Location of Top Earners: Evidence from Star Scientists. American Economic Review, 107 (7): 1858–903.
- Dudar, O., and J. Voget. (2016). Corporate Taxation and Location of Intangible Assets. Proceedings: Annual Conference on Taxation and Minutes of the Annual Meeting of the National Tax Association, 109: 1–30.
- Dischinger, M., and N. Riedel. (2011). Corporate Taxes and the Location of Intangible Assets Within Multinational Firms. Journal of Public Economics, 95 (7–8): 691–707.
- Ljungqvist, A., L. Zhang and L. Zuo. (2017). Sharing Risk with the Government: How Taxes Affect Corporate Risk Taking. Journal of Accounting Research, 55 (3): 669–707.
- Krieger, J., D. Li and D. Papanikolaou. (2022). Missing Novelty in Drug Development. Review of Financial Studies, 35 (2): 636–79.
- Langenmayr, D., and R. Lester. (2018). Taxation and Corporate Risk-Taking. Accounting Review, 93 (3): 237–66.
- Cullen, J.B ., and R. H. Gordon. (2007). Taxes and Entrepreneurial Risk-Taking: Theory and Evidence for the U.S. Journal of Public Economics, 91 (7–8): 1479–505.
- DeBacker, J., B. T. Heim, S. P. Ramnath and J. M. Ross. (2019). The Impact of State Taxes on Pass-Through Businesses: Evidence from the 2012 Kansas Income Tax Reform. Journal of Public Economics, 174: 53–75.
- Djankov, S., T. Ganser, C. McLiesh, R. Ramalho and A. Shleifer. (2010). The Effect of Corporate Taxes on Investment and Entrepreneurship. American Economic Journal: Macroeconomics, 2 (3): 31–64.
- Almeida, H., P. H. Hsu, D. Li and K. Tseng. (2021). More Cash, Less Innovation: The Effect of the American Jobs Creation Act on Patent Value. Journal of Financial and Quantitative Analysis, 56 (1): 1–28.
- Dharmapala, D., C. F. Foley and K. J. Forbes. (2011). Watch What I Do, Not What I Say: The Unintended Consequences of the Homeland Investment Act. Journal of Finance, 66 (3): 753–87.
- Albertus, J. F., B. Glover and O. Levine. (2024). The Real and Financial Effects of Internal Liquidity: Evidence From the Tax Cuts and Jobs Act. Social Science Research Network. https://papers.ssrn.com/abstract=4471259.
- Scherer, F. M. (2001). The Link Between Gross Profitability and Pharmaceutical R&D Spending. Health Affairs, 20 (5): 216–20.
- Krieger, J., D. Li and D. Papanikolaou. (2022). Missing Novelty in Drug Development. Review of Financial Studies, 35 (2): 636–79.
- Li, Q., M. S. Ma and T. Shevlin. (2021). The Effect of Tax Avoidance Crackdown on Corporate Innovation. Journal of Accounting and Economics, 71 (2): 101382.
- Skeie, Ø. B., Å. Johansson, C. Menon and S. Sorbe. (2017). Innovation, Patent Location and Tax Planning by Multinationals. https://www.oecd-ilibrary.org/economics/innovation-p.atent-location-and-tax-planning-by-multinationals_b08459e5-en
- Johansson, Å., ØB Skeie, S. Sorbe and C. Menon. (2017). Tax Planning by Multinational Firms: Firm-Level Evidence from a Cross-Country Database. https://www.oecd-ilibrary.org/economics/tax-planning-by-multinational-firms_9ea89b4d-en.
- Evers, L., H. Miller and C. Spengel. (2015). Intellectual Property Box Regimes: Effective Tax Rates and Tax Policy Considerations. International Tax and Public Finance, 22 (3): 502–30.
- Bösenberg, S., and P. H. Egger. (2017). R&D Tax Incentives and the Emergence and Trade of Ideas. Economic Policy, 32 (89): 39–80.
- Klein, M., and L. Linnemann. (2024). Tax Shocks, Firm Entry and Productivity in the Open Economy. Journal of International Money and Finance, 149: 103203.
- Kolev, J., A. Haughey, F. Murray and S. Stern. (2022). Of Academics and Creative Destruction: Startup Advantage in the Process of Innovation. NBER Working Paper w30362.
- Polidoro, F., and C. Jacobs. (2024). Knowledge Diffusion in Nascent Industries: Asymmetries Between Startups and Established Firms in Spurring Inventions by Other Firms. Strategic Management Journal, 45 (4): 807–45.
- Cohen, W. M., M. J. Higgins, W. D. Miles and Y. Shibuya, and . (2025). Blockbuster Products, Sequels and the Nature of Innovation. SSRN. https://www.ssrn.com/abstract=5086278.
- Fieldhouse, A. J. , and K. Mertens. (2024). The Returns to Government R&D: Evidence from U.S. Appropriations Shocks. Federal Reserve Bank of Dallas, no. 2305. https://www.dallasfed.org/research/papers/2023/wp2305.
- Bom, P. R. D., and J. E. Ligthart. (2014). What Have We Learned from Three Decades of Research on the Productivity of Public Capital? Journal of Economic Surveys, 28 (5): 889–916.
- Bloom, N., J. Van Reenen and H. Williams. (2019). A Toolkit of Policies to Promote Innovation. Journal of Economic Perspectives, 33 (3): 163–84.
- Van Reenen, J. (2021). Innovation and Human Capital Policy. NBER Working Paper 28713
- Stantcheva, S. (2023). The Effects of Taxes on Innovation: Theory and Empirical Evidence. In The Economics of Creative Destruction,edited by U. Akcigit and J. Van Reenen. Cambridge, MA: Harvard University Press, 653–80.
- Eskandari, R., and M. Zamanian. (2023) Heterogeneous Responses to Corporate Marginal Tax Rates: Evidence from Small and Large Firms. Journal of Applied Econometrics, 38 (7): 1018–47.
Disclosure
The Schaeffer Center White Paper Series is published by the Leonard D. Schaeffer Center for Health Policy & Economics at the University of Southern California. Papers published in this series undergo a rigorous peer-review process, led by the Director of Quality Assurance at the USC Schaeffer Center.
This process includes external review by at least two scholars not affiliated with the Center. This white paper was supported by the Schaeffer Center. A complete list of supporters of the Schaeffer Center can be found in our annual report (available here). At all times, the independence and integrity of the research is paramount, and the Center retains the right to publish all findings from its research activities. The views expressed herein are those of the authors and do not necessarily represent the views of the Schaeffer Center or its sponsors. Disclosures reported by authors are available here.