Schaeffer Center White Paper Series | DOI: 10.25549/9a5y-wy73
Cite: (.enw, .ris)
Policy Context
Rates of obesity have been rising since the 1980s, and today approximately 42% of adults have obesity.1 Current policies have failed to reverse these trends and their complex sequelae—including greater rates of diabetes, hypertension, heart disease, stroke and cancer. Although effective anti-obesity medications (AOMs) are now available, access remains a challenge, as Medicare and many private insurance plans do not cover them. The question becomes: Is it worth it to society to invest in broader access?
We estimate the social returns to AOM treatment across the adult population and how these returns vary with underlying health risks. Specifically, our analysis simulates lifetime outcomes from treating obesity including life years gained, life years with diabetes avoided, net lifetime social value and the rate of social return on investment.
Our results show that broad access to AOMs generates significant societal benefits. Life expectancy rises by as much as 1.8 years, and Americans spend fewer years living with chronic diseases like diabetes. Although all patients accrue positive net social value from treatment, younger and healthier patients (i.e., those with lower diabetes risk score or moderate BMI ranging from 30–39) accrue the greatest social returns. The estimated benefits vary by age and health-risk group, but we find that broad access generates real returns exceeding 13% per year even after accounting for treatment costs—performing better than the U.S. stock market over this century. Our results suggest significant social loss from limiting GLP-1 coverage.
Key Takeaways
- Despite their demonstrated efficacy, GLP-1s are frequently not covered by insurers for weight loss. Less than one-third of insurers—and only 1% of individual Affordable Care Act market plans—provide coverage.
- Investing in expanded access to AOMs generates substantial social returns, even after accounting for treatment costs. The social returns exceed those from other private and public capital investments commonly recognized as valuable.
- Perhaps surprisingly, the social returns from treating obesity are highest for those who are younger and at lower risk, thereby casting doubt on policies limiting AOM coverage to people with pre-existing conditions like diabetes.
A press release covering this white paper’s findings is available here.
Abstract
Obesity is a public health crisis in the United States. Despite demonstrated efficacy, anti-obesity medications (AOM) are frequently not covered by insurers and Medicare for weight loss. Analysis of the potential returns to treatment are needed to inform the debate for broader access to AOMs.
We estimate the lifetime social returns from expanding AOM treatment for various ages and risk groups using the Future Adult Model (FAM), a dynamic microsimulation of American adults. We simulate lifetime outcomes for a cohort of Americans aged 25 years or older in 2025 who do not have diabetes but who do qualify for AOM treatments based on FDA-approved indications (BMI ≥ 30 kg/m2, or BMI ≥ 27 kg/m2 and a weight-related comorbidity). We compare outcomes under the status quo and with a policy that provides expanded access to those eligible for treatment. We assume AOMs reduce body weight by 15–20%, based on both trial and real-world evidence for patients without diabetes, and generic GLP-1s become available in 2032. We estimate lifetime trajectories of health, medical spending and compute social benefits net of AOM treatment costs. We summarize the results by measuring the internal rate of return to expanded access to AOMs by age and risk groups.
Our results find that expanded access to AOMs generates significant benefits. Life expectancy rises, and Americans spend fewer years living with chronic diseases like diabetes. People initiating therapy between 25 and 34 years of age gain as much as 1.8 years of life while spending up to 5.9 fewer years without diabetes. After accounting for treatment costs, total lifetime net social value is positive for all people except those age 65–74 with a BMI < 30 kg/m2. The social rate of return from expanded access exceeds 13% for all subgroups with BMI ≥ 30 kg/m2.
Introduction
Obesity represents a serious and largely unmitigated public health crisis in the United States. Rates of obesity have been rising since the 1980s, and today approximately 42% of adults have obesity.1 Absent effective intervention, the prevalence of obesity could exceed 50% in the next decade.2 Current policies have failed to reverse these trends and their complex sequelae—including greater rates of diabetes, hypertension, heart disease, stroke and cancer.3-5 Obesity is the second-leading cause of preventable deaths, and society spends $260 billion annually treating the disease.6
The introduction of a new class of anti-obesity medications (AOMs) offers an opportunity to better address this crisis. Semaglutide and tirzepatide are weekly glucagon-like peptide-1 (GLP-1) injections originally approved by the Food and Drug Administration (FDA) to treat diabetes and more recently approved to treat obesity. In clinical trials, higher doses of these drugs helped people lose 15% and 20% of their body weight, respectively.7,8 GLP-1s have demonstrated efficacy in preventing cardiovascular disease, chronic kidney disease and pre-diabetes; and ongoing trials are exploring their efficacy against sleep apnea, Parkinson’s disease and other chronic conditions.9-12 Additional multi-specific peptides offer the chance of improved tolerability or efficacy for future users.13
Despite their demonstrated efficacy, GLP-1s are frequently not covered by insurers for weight loss. Fewer than one-third of insurers—and only 1% of individual Affordable Care Act market plans—provide coverage.14,15 This may not be surprising, since private insurers can be reluctant to invest in prevention,16,17 and the benefits of weight loss may not be fully realized until people transition to Medicare. Additionally, the high prevalence of obesity has led to headline-grabbing estimates of total treatment costs.18,19 However, broader access could generate substantial long-term benefits. Decisions about expanding access—either in private or public insurance programs—would benefit from estimates of the lifetime returns to treatment and how they vary within the population.
We estimate the social returns to expanded AOM treatment using the Future Adult Model (FAM), a dynamic microsimulation of American adults aged 25 and older. FAM and its predecessors were featured in two National Academies of Science reports,20,21 and variants have been developed globally.22 FAM has been shown to perform at least as well as actuarial models, while providing more information on quality of life and economic outcomes.23 FAM has been used to study the value of access to novel treatments generally,24-26 with specific applications to Alzheimer’s disease,27,28 elevated lipids,29-31 heart failure,32 cardiovascular risks33 and delayed aging.34 This makes FAM well suited to estimate the lifetime costs and benefits of expanded access to GLP-1s and how they differ by age and underlying risk.
Methods
The FAM combines data from several large, nationally representative surveys: the Panel Study of Income Dynamics (PSID), the Health and Retirement Study (HRS), the Medical Expenditure Panel Survey (MEPS) and the Medicare Current Beneficiary Survey (MCBS). The transitions underlying FAM come from the PSID, a longitudinal survey tracking people from age 25 and their family members. The combination of datasets provides more comprehensive information than any single national survey.
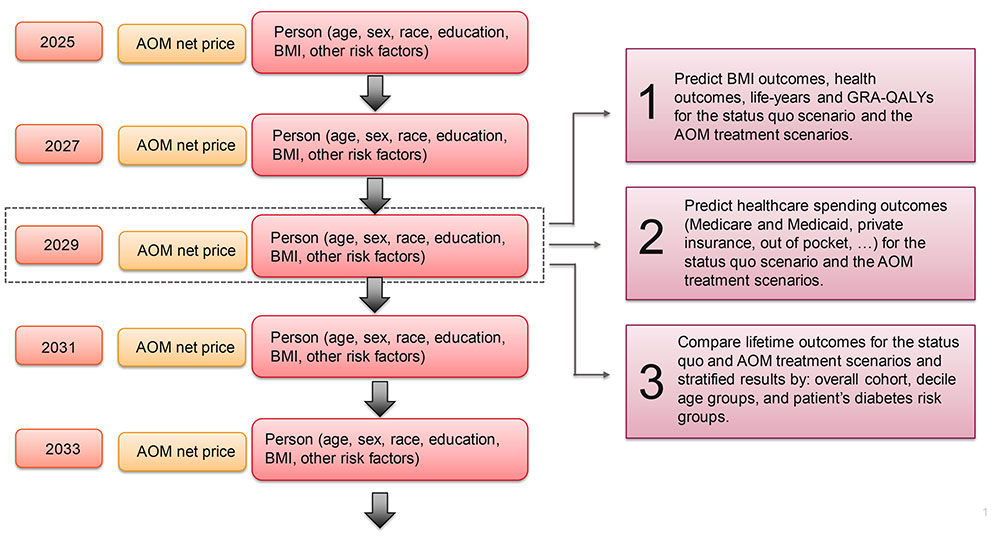
Using FAM, we simulate lifetime outcomes for a nationally representative cohort of Americans aged 25 years or older who do not have diabetes but who do qualify for AOM treatments based on the FDA-approved indications (BMI ≥ 30 kg/m2, or BMI ≥ 27 kg/m2 and a weight-related comorbidity). The simulation starts in 2025, and we project lifetime trajectories of health, medical spending, AOM treatment costs and other economic outcomes, facilitating calculations of net societal value and rates of return for alternative AOM uptake scenarios. This approach is depicted in e in the supplemental materials; a full technical description of the model is available online.35
FAM has a two-year cycle that mimics the frequency of the underlying survey data. Each cycle, FAM predicts AOM treatment costs, health outcomes and total healthcare spending. We simulate lifetime outcomes for each individual with—and without—expanded AOM access, and then report differential outcomes by age and risk subgroup. More detail is provided below.
AOM Treatment Costs
To estimate treatment cost, we use the net price of AOM medications currently available for weight loss. Net prices account for the (often hidden) discounts negotiated by pharmacy benefit managers, government and other payers. While exact drug-specific discounts are confidential, researchers have estimated discounts of roughly 52% off list price generally.36 For semaglutide, researchers estimated 41% discounts in 2022, prior to the introduction of tirzepatide.37 Using more recent data, Congressional Budget Office estimated average AOM net prices of $5,900 per year, which serves as our treatment cost in the initial year.38
We then project AOM treatment costs annually, informed by four market observations. First, branded net prices have fallen or remained relatively stable, in real terms, over the past decade.39,40 Second, on average, prices fall 74% below the pre-expiration list price when generics enter the market.a 41 Third, experience with other high-cost classes, like novel drugs for hepatitis C and HIV, suggests branded competition brings prices down before generic entry.42 And fourth, the AOM pipeline is very robust, with 124 medications in clinical trials as of March 2024—eight of which are being tested in phase 3 trials.43 Thus, we conservatively assume constant net prices until semaglutide’s patent expires in 2031. We allow for a 50% price drop in the first year of generic competition (2032) and the full 74% decrease in the second year (2033).41 We assume the generic price persists after the second year. While there is a robust peptide pipeline,44 we conservatively do not allow prices to fall before generic entry.
Health Outcomes
FAM uses individual characteristics to estimate health transition probabilities across two-year periods. Transition probabilities are modeled as clinically informed first-order Markov processes depending on age, sex, education, race, health conditions, body mass index (BMI) and functional status. Health conditions such as heart disease, stroke, diabetes, cancer and lung disease are self-reported in the PSID, and chronic health conditions are treated as absorbing—i.e., once people report being diagnosed with a condition, they have that condition until death. In every model cycle, FAM uses the health transition models to predict each person’s health status, which in turn informs estimates of medical spending and other policy outcomes.
We model obesity in FAM to mimic specific features of long-term weight-management treatments, as described in prior research.45 Specifically, we adjust for self-reporting bias in BMI using data on measured versus reported heights and weights from the National Health and Nutrition Examination Survey. And, to account for its persistence, we allow an individual’s BMI in the prior two cycles (four years total) to impact current BMI projections in a log-linear format with splines at BMI levels of 20, 25, 30, 35 and 40 kg/m2.
Healthcare Spending
FAM predicts total medical spending as a function of age, gender, race/ethnicity, education, chronic health conditions and BMI. The estimates represent total medical expenditures save for AOM treatment costs, which we model separately. For those under the age of 65, we base our estimates of total medical expenditures on the MEPS. Then, for everyone age 65 and older and those who qualify for Medicare due to federal disability enrollment, we base our estimates of total medical spending on the MCBS and include functional limitations, nursing home residency and mortality as additional explanatory variables.
Expanded Access to AOMs
We consider two scenarios: the status quo and expanded access to AOMs (“treatment scenario”). Under the status quo, FAM simulates outcomes for the cohort of individuals who:
- Do not have an existing diabetes diagnosis;
- Are aged 25 or older;
- Qualify, under FDA guidelines, to take new GLP-1 weight-loss treatments (BMI ≥ 30 kg/m2, or BMI ≥ 27 kg/m2 and a weight-related comorbidity).
The status quo scenario holds current coverage policies and rates constant, leaving access to new therapies unchanged and uptake at current levels. The expanded access scenario gives clinically eligible people access (insurance coverage) to a treatment that reduces BMI by 20%, reflecting mean weight loss from recent clinical trials in higher-dose regimens.7,8 Evidence suggests that treatment discontinuation can lead to people rapidly regaining weight lost during treatment. Therefore, we assumed that people remain on continuous therapy to maintain their initial weight loss. To reflect natural weight fluctuations after treatment, we model weight using FAM’s empirically based BMI transition model but cap total weight gain or loss at 5% of post-treatment BMI. We lift these caps at age 75 to allow for the natural weight loss seen in elderly populations. To estimate the costs and benefits associated with expanded access to AOM treatments, we compare lifetime health and healthcare spending outcomes between the two scenarios.
Risk Groups
The lifetime benefits of weight reduction likely accrue heterogeneously, depending on age and underlying risk. Treating those with the highest BMI might focus on people most vulnerable to adverse outcomes, but treating earlier in the BMI growth process provides more opportunities to avoid irreversible complications. Similarly, starting treatment at younger ages may prevent more chronic disease but also bring more years of cost. To study how benefits are distributed, we stratify people by age at treatment initiation and by risk assessed one of two ways:
- BMI at time of treatment initiation; and
- 10-year risk of developing diabetes at treatment initiation
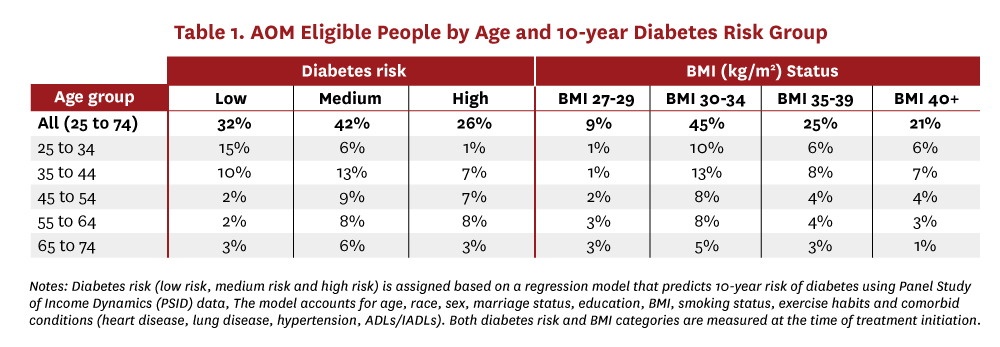
The PSID survey follows people longitudinally over time and tracks their development of chronic conditions. We use responses in 2009 and 2019 to develop a regression-based model predicting each person’s risk of developing diabetes in the next 10 years. Specifically, the model uses people’s baseline characteristics in 2009 such as, age, race, sex, marital status, education, BMI, smoking status, exercise habits and comorbid conditions (heart disease, lung disease, hypertension, ADLs/IADLs), to predict the presence of diabetes in 2019. People are then stratified into low-, medium- and high-risk groups based on their 10-year probability of developing diabetes (less than 10%, 10–20% and greater than 20% respectively). The distribution of people into each of the age-risk and age-BMI stratification categories is shown in Table 1.
Results
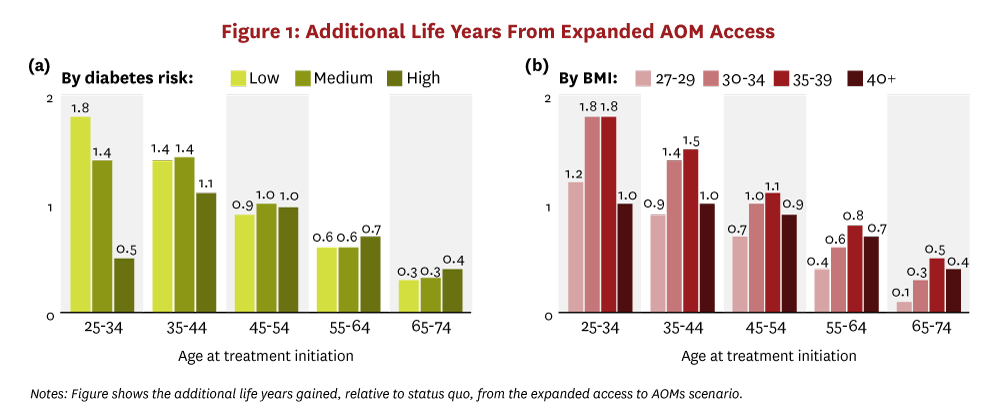
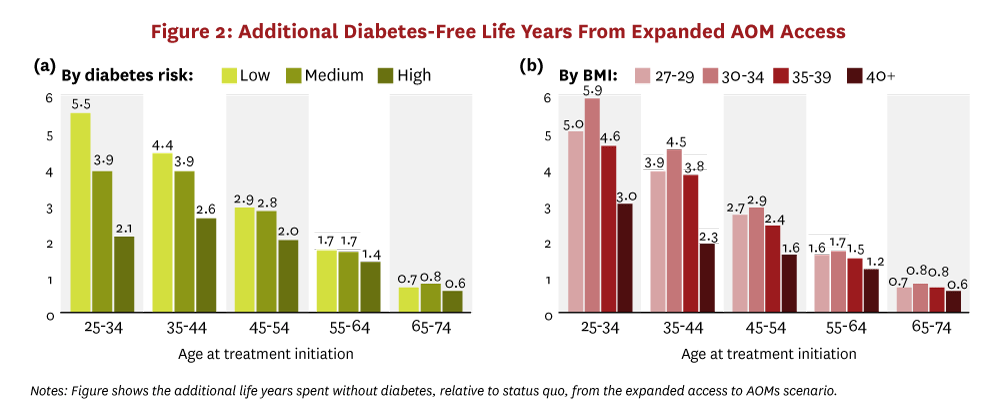
Cohort simulations of Americans 25 years and older who are eligible for AOM treatment find that a 20% reduction in BMI would generate large health and economic benefits for individual people and for society. Expanded access to AOMs generates significant increases in life expectancy for people and increases the number of diabetes-free years. Figure 1 shows the increase in overall life expectancy, and Figure 2 shows the increase in diabetes-free years. Results are stratified by the decadal age range in which treatment begins and by either peoples’ 10-year risk category for developing diabetes (panel “a”) or peoples’ baseline BMI range (panel “b”). Younger people stand to gain the most longevity from broad AOM access. Treatment-eligible people between the ages of 25 and 34 gain as much as 1.8 years of life, on average, and spend 2.1 to 5.9 fewer years with diabetes. This pattern of longer lives and fewer years with diabetes persists across all age groups initiating treatment before developing diabetes. Even people who initiate AOMs later, ages 65-74, gain almost six months of additional life, on average, and shrink their average time with diabetes by three-quarters of a year.
The simulations also demonstrate that the health benefits from expanded access to AOMs are not always positively correlated with peoples’ diabetes risk or baseline BMI. In fact, in the younger age groups, people in the lowest diabetes risk category experience the greatest longevity gains. These people also see the largest increase in diabetes-free years. This result highlights the fact that early intervention on weight does not just delay obesity-related comorbid conditions but it can also prevent them entirely. Similarly, among people younger than 55, those initiating treatment with BMI between 30–39 experience the greatest gains in life-years and diabetes-free years. The greater increase in diabetes-free years for people with less severe obesity persists across all age groups.
Net social value and rates of return
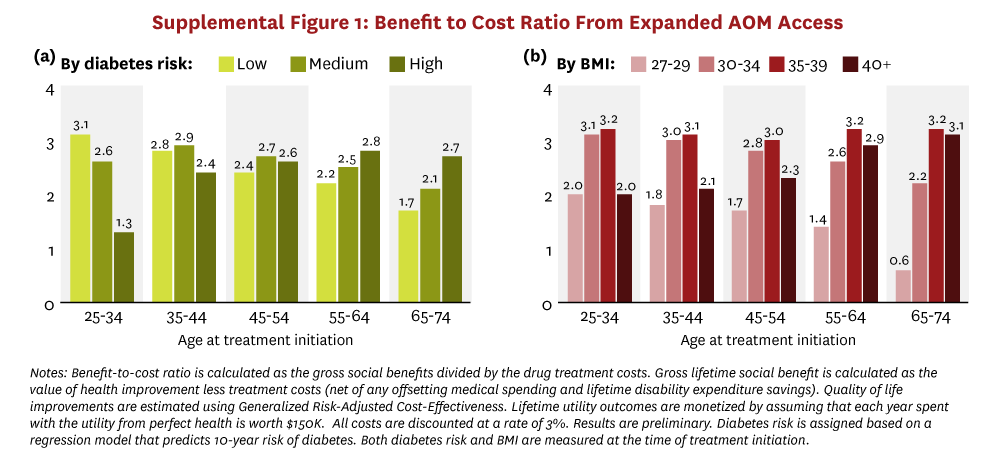
Substantial attention has been focused on the cost implications of GLP-1 treatment. To compare costs with the benefits above, we calculated net lifetime social value as 1) the value of gains in longevity and quality of life, plus 2) the lifetime disability expenditure savings, minus 3) the incremental lifetime net medical spending (treatment costs minus medical cost offsets). We account for quality of life improvements associated with expanded access to AOMs using Generalized Risk-Adjusted Cost-Effectiveness (GRACE), which (unlike traditional cost-effectiveness) complies with Inflation Reduction Act prohibitions on Centers for Medicare & Medicaid Services’ use of discriminatory value assessment methods.46,47 We employ the conventional assumption that each year spent in perfect health is worth $150K,48 and all costs and benefits are discounted at a rate of 3%, except in internal rate of return (IRR) calculations, which do not require a discount rate.49
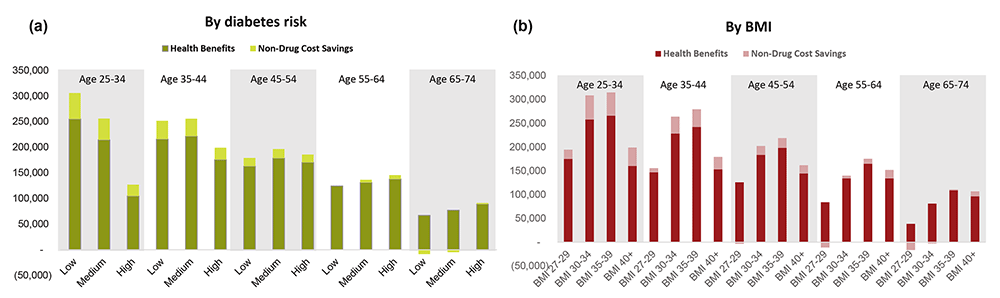
The net social value from expanded AOM access is illustrated in Figure 3 and stratified by the age-decade of people at treatment initiation and either by 10-year diabetes risk category or by baseline BMI. Total lifetime net social value is shown in panels a and b. All subgroups receive positive net social value from treatment on average, except for patients over age 65 with BMI between 27 and 30. Additionally, younger and healthier (in terms of lower diabetes risk score or moderate BMI ranging from 30–39) people generate the greatest social value. For example, a 25- to 34-year-old person with a low 10-year risk of developing diabetes will generate $45K more in lifetime social value ($206K), on average, than a 35 to 44-year-old person at similar risk ($161K), and $47K more than a similarly aged person at medium risk ($159K). Similarly, across almost all age groups, people with more moderate obesity levels (BMI between 30 and 39) generate twice as much lifetime social value when compared to people with a BMI under 30. When aggregated across the entire cohort, our analysis suggests that the total net social value from treating all adults eligible for AOMs in 2025 will reach almost $10.1 trillion.
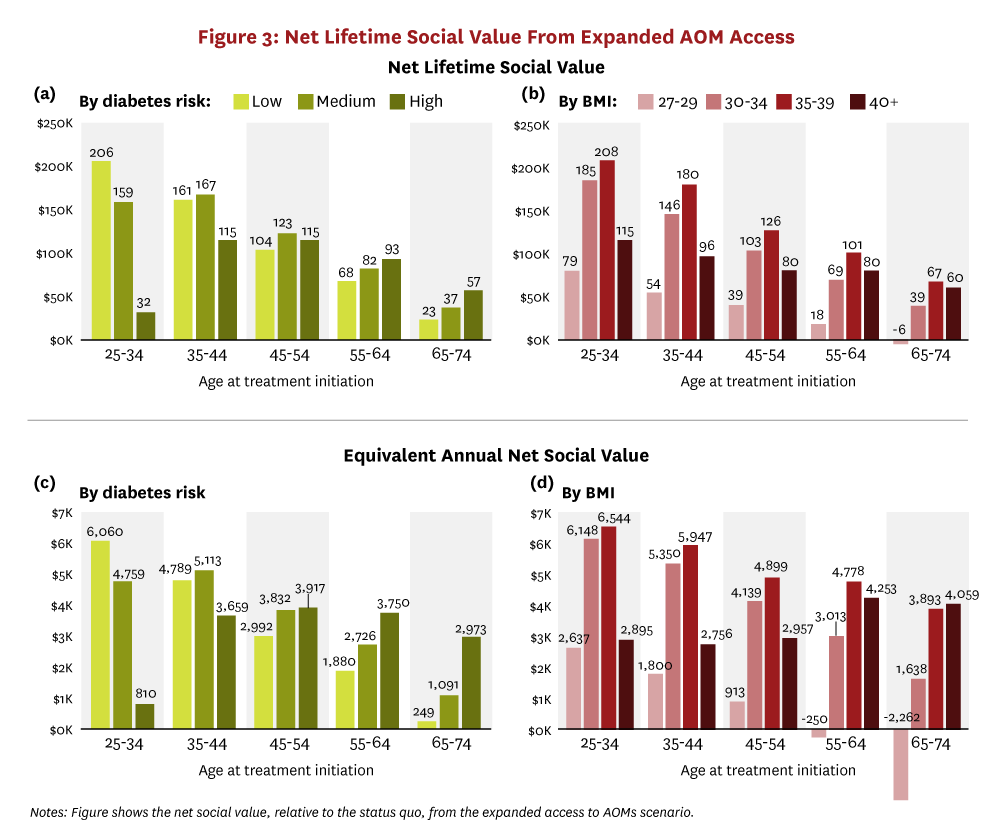
To place the lifetime net social value findings in context, the bottom half of Figure 3 shows the equivalent annual net social value from expanded AOM access, which is the average value per year that society would accrue if each person’s total net social value was distributed equally over his lifetime. In other words, panels c and d calculate the annual social return that people accrue from current AOMs. For example, treating a 25- to 34-year-old person with BMI of 35–39 would generate $6,544 in annual social value. The equivalent annual social value estimates reinforce the finding of positive value from expanded access to AOMs for treatment-eligible adults.
Finally, when we compare lifetime outcomes across the cohort of Americans age 25+ who are eligible for treatment with GLP-1s, we see the greatest health benefits and the highest treatment costs accruing to younger people in better overall health (i.e., people at a lower risk of developing diabetes in the next 10 years or with more moderate levels of BMI). This naturally raises the question of which cohorts insurers should target for AOM coverage. To shed light on this, we calculated the IRR on covering AOM therapies for each diabetes risk group and for each BMI group. The IRR measures the constant annual rate of return that society implicitly earns on the average dollar invested into AOM treatment. Formally, it is the discount rate that would make the net present value of all future cashflows equal to zero—the higher the IRR, the greater the social value of the project.49 The 30-year IRR results from our analysis are presented in Figure 4.
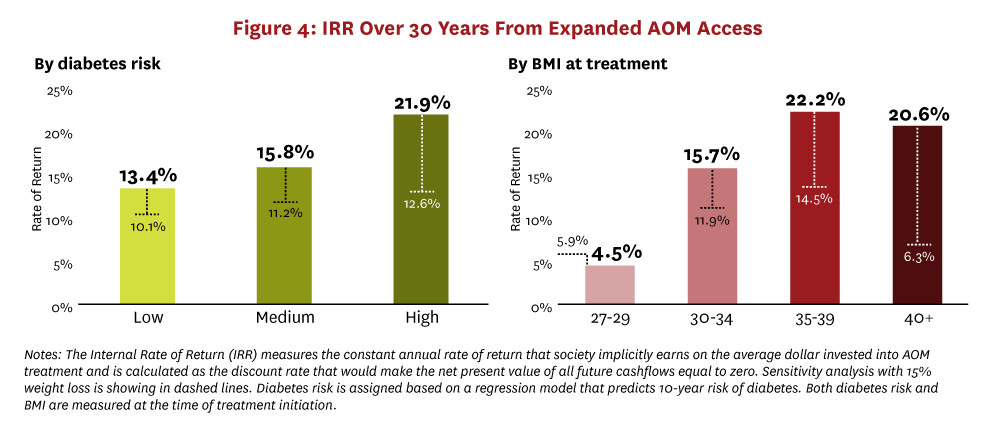
The 30-year IRR from effectively treating obesity is greater than 13% for all subgroups with a BMI greater than 30. In fact, people with the highest risk for developing diabetes or a BMI greater than 35 represent the best return with an IRR of 21% or more. Figure 4 also shows the IRR for a 15% weight reduction instead of the 20% reduction we modeled in our main results. This sensitivity analysis demonstrates that current treatments can still offer a very high rate of return even if the real world efficacy is lower than the results in clinical trials.50
Discussion
Prior literature has documented the clinical benefits but also the substantial costs of AOM treatments.45,51,52 In Medicare, some have estimated that annual costs could exceed $250 billion and may even reach $1 trillion.18,19 Private insurers have also focused on the budget impact when limiting access.17 These estimates, while headline worthy, often assume few or no price rebates, and they miss the medical cost-offsets that treating obesity will generate—indeed, prior research suggests that Medicare coverage of weight-loss therapies could save federal taxpayers as much as $245 billion in the first 10 years in reduced medical spending.45
Thus, the substantial costs need to be weighed against the (dollar-denominated) clinical benefits. This research demonstrates that, despite high aggregate costs, reductions in BMI are valuable from a societal perspective for all or nearly all people with obesity, not just those who have already acquired chronic illness. This result depends in part on our assumption that long-term, real-world weight loss will mirror the experience in clinical trials; long-term randomized studies are needed for pressure testing this assumption.b
On the cost side, we abstract away from the possibility that branded-price competition will drive down GLP-1 net prices before generic entry; if this occurs, actual societal returns will exceed our estimates. We also assume that generic competition for semaglutide will drive down the prices for the entire AOM market. In fact, current prices for compounded versions of semaglutide and tirzepatide suggest that the generic market price could fall even lower. Generic versions of tirzepatide are expected between 2036 and 2039, and these could further impact the market price for AOMs.
Our simulations yield insight into the distribution of benefits across different population subgroups. We find that younger people would accrue greater health gains, but also more years of treatment cost. Our IRR calculations account for these competing dynamics, and we find that expanded access to AOMs generates compelling rates of return across all subgroups. In fact, the rates meet or substantially exceed other private and public uses of capital recognized as valuable, including the 7% annualized return on the S&P 500 between 2000 and 2024 and the 13% annual return on investments into early childhood education programs for disadvantaged children.53 Similarly, the equivalent annual net social value from AOM treatment ranged from $250-$6500 across subgroups, which represents 0.5-9.5% of per capita GDP in 2024.
Simulation results also reveal that, for all ages, people initiating treatment in the low- and medium-risk diabetes groups and moderate BMI categories experience improved longevity and significant reductions in time spent living with diabetes. These same people also generate high social value from treatment and an IRR in excess of benchmark rates of return. Expanded access to AOM treatments avoids or delays obesity-related comorbidities, improving the quality and quantity of life for a set of people.
In sum, expanded access to AOMs could generate $10 trillion in lifetime net social value to those who are currently treatment-eligible. This is tantamount to about 6% of the current U.S. household wealth.54 Finding a path forward to expanded access makes good sense as a societal investment; the real challenge will be figuring out who should bear the costs.
a. Although generic peptide therapies like GLP-1 AOMs may be more complex to produce in the generic market than small molecule therapies, the initial evidence on the price impacts is consistent with our assumed discounts. According to GoodRX, generic Victoza sells for 74% less than the branded list price, and generic glucagon is selling for 60% less than the branded version.
b. Limited data are available on discontinuation rates for GLP-1 therapies, so we assume patients will remain on treatments and maintain their initial weight loss to demonstrate the total potential value of AOMs. However, more research is needed to understand real-world uptake and discontinuation patterns.
Disclosure
The Schaeffer Center White Paper Series is published by the Leonard D. Schaeffer Center for Health Policy & Economics at the University of Southern California. Papers published in this series undergo a rigorous peer-review process, led by the Director of Quality Assurance at the USC Schaeffer Center. This process includes external review by at least two scholars not affiliated with the Center. This white paper was supported by the Schaeffer Center, which receives funding from foundations, government agencies, individuals, and corporations— including companies that have interests in obesity treatments. A complete list of supporters of the Schaeffer Center can be found in our annual report (available here). The Future Adult Model was developed with support from the National Institute on Aging (P30AG024968). At all times, the independence and integrity of the research is paramount, and the Center retains the right to publish all findings from its research activities. The views expressed herein are those of the authors and do not necessarily represent the views of the Schaeffer Center or its sponsors. Disclosures reported by authors are available here.
References
- Stierman B, Afful J, Carroll MD, et al. National Health and Nutrition Examination Survey 2017–March 2020 prepandemic data files development of files and prevalence estimates for selected health outcomes. 2021.
- Ward ZJ, Bleich SN, Cradock AL, et al. Projected Us State-level Prevalence of Adult Obesity and Severe Obesity. New England Journal of Medicine. 2019;381(25):2440-2450.
- Sauer AG, Siegel RL, Jemal A, Fedewa SA. Updated Review of Prevalence of Major Risk Factors and Use of Screening Tests for Cancer in the United States. Cancer Epidemiology, Biomarkers & Prevention. 2017;26(8):1192-1208.
- CDC. Adult Obesity Facts. https://www.cdc.gov/obesity/adult-obesity-facts/index.html. Published 2024. Updated 5/14/2024. Accessed 10.7.2024, 2024.
- Vos MB, Welsh J. Childhood Obesity: Update on Predisposing Factors and Prevention Strategies. Current Gastroenterology Reports. 2010;12:280-287.
- Sturm R. The Effects of Obesity, Smoking, and Drinking on Medical Problems and Costs. Health Affairs. 2002;21(2):245-253.
- Jastreboff AM, Aronne LJ, Ahmad NN, et al. Tirzepatide Once Weekly for the Treatment of Obesity. New England Journal of Medicine. 2022;387(3):205-216.
- Wilding JP, Batterham RL, Calanna S, et al. Once-weekly Semaglutide in Adults With Overweight or Obesity. New England Journal of Medicine. 2021;384(11):989-1002.
- Perkovic V, Tuttle KR, Rossing P, et al. Effects of Semaglutide on Chronic Kidney Disease in Patients With Type 2 Diabetes. New England Journal of Medicine. 2024;391(2):109-121.
- Malhotra A, Grunstein RR, Fietze I, et al. Tirzepatide for the Treatment of Obstructive Sleep Apnea and Obesity. New England Journal of Medicine. 2024.
- Ryan DH, Lingvay I, Colhoun HM, et al. Semaglutide Effects on Cardiovascular Outcomes in People With Overweight or Obesity (Select) Rationale and Design. American Heart Journal. 2020;229:61-69.
- Wilkinson L, Holst‐Hansen T, Laursen PN, Rinnov AR, Batterham RL, Garvey WT. Effect of semaglutide 2.4 mg once weekly on 10‐year type 2 diabetes risk in adults with overweight or obesity. Obesity. 2023;31(9):2249-2259.
- Melson E, Ashraf U, Papamargaritis D, Davies MJ. What is the pipeline for future medications for obesity? International Journal of Obesity. 2024:1-19
- Munk CW. The Bottom Line. 2024. https://www.cnbc.com/2024/02/16/what-you-need-to-know-about-health-coverage-for-new-weight-loss-drugs.html. Published February 16, 2024. Accessed October 9, 2024.
- Cox JLaC. Insurer strategies to control costs associated with weight loss drugs. Health System Tracker. 2024. https://www.healthsystemtracker.org/brief/insurer-strategies-to-control-costs-associated-with-weight-loss-drugs/. Published June 12, 2024. Accessed October 9, 2024.
- Goldman DP, Hagopian K. It is Time for Universal Coverage Without Breaking the Bank. Journal of Policy Analysis and Management. 2018;37(1):182-188.
- Robbins R. Buried in Wegovy costs, North Carolina will stop paying for obesity drugs. The New York Times. 2024.
- Baig K, Dusetzina SB, Kim DD, Leech AA. Medicare Part D Coverage of Antiobesity Medications—challenges and Uncertainty Ahead. New England Journal of Medicine. 2023;388(11):961-963.
- Brian Deese JG, and Ryan Cummings The Miracle Weight-Loss Drug Is Also a Major Budgetary Threat. In. The New York Times. March 4, 2024 ed2024.
- National Academies of Sciences E, Medicine. The Growing Gap in Life Expectancy by Income: Implications for Federal Programs and Policy Responses. Washington, DC: The National Academies Press; 2015.
- National Academies of Sciences Engineering and Medicine. Improving Representation in Clinical Trials and Research: Building Research Equity for Women and Underrepresented Groups. Washington DC: The National Academies Press;2022.
- OECD. Preventing Ageing Unequally. 2017.
- Leaf DE, Tysinger B, Goldman DP, Lakdawalla DN. Predicting Quantity and Quality of Life With the Future Elderly Model. Health Economics. 2021;30(S1).
- Shekelle PG, Ortiz E, Newberry SJ, et al. Identifying Potential Health Care Innovations for the Future Elderly. Health Aff (Millwood). 2005;24 Suppl 2:W5R67-76.
- Goldman DP, Shang B, Bhattacharya J, et al. Consequences of health trends and medical innovation for the future elderly. Health Aff (Millwood). 2005;24 Suppl 2:W5R5-17.
- Goldman DP, Shekelle PG. Health Status and Medical Treatment of the Future Elderly: Final Report. Santa Monica, CA: RAND Corporation;2004.
- Zissimopoulos J, Crimmins E, St.Clair P. The Value of Delaying Alzheimer’s Disease Onset. Forum for Health Economics and Policy. 2015;18(1):25.
- Zissimopoulos JM, Tysinger BC, St. Clair PA, Crimmins EM. The impact of changes in population health and mortality on future prevalence of Alzheimer’s disease and other dementias in the United States. The Journals of Gerontology: Series B. 2018;73(suppl_1):S38-S47.
- Gaudette E, Goldman DP, Messali A, Sood N. Do Statins Reduce the Health and Health Care Costs of Obesity? Pharmacoeconomics. 2015.
- Cheng WH, Gaudette E, Goldman DP. PCSK9 Inhibitors Show Value for Patients and the US Health Care System. Value in Health. 2017;20(10):1270-1278.
- Jena AB, Blumenthal DM, Stevens W, Chou JW, Ton TG, Goldman DP. Value of improved lipid control in patients at high risk for adverse cardiac events. American Journal of Managed Care. 2016;22(6):e199-207.
- Van Nuys KE, Xie Z, Tysinger B, Hlatky MA, Goldman DP. Innovation in Heart Failure Treatment: Life Expectancy, Disability, and Health Disparities. JACC: Heart Failure. 2018.
- Goldman DP, Zheng Y, Girosi F, et al. The benefits of risk factor prevention in Americans aged 51 years and older. American Journal of Public Health. 2009;99(11):2096-2101.
- Kirkland JL. Translating advances from the basic biology of aging into clinical application. Experimental Gerontology. 2013;48(1):1-5.
- Goldman DP LD, Tysinger B,. The Future Adult Model: Technical Documentation. In: University of Southern California; 2024.
- Fein AJ. Gross-to-Net Bubble Update: 2021 Pricing Realities at 10 Top Drugmakers. Drug Channels. 2022. https://www.drugchannels.net/2022/05/gross-to-net-bubble-update-pricing.html. Published May 10, 2022. Accessed October 9, 2024.
- Hernandez I, Sullivan SD. Net prices of new antiobesity medications. Obesity. 2024;32(3):472-475.
- Office CB. How Would Authorizing Medicare to Cover Anti-Obesity Medications Affect the Federal Budget? October 2024 2024.
- Lakdawalla D, Li M. Association of drug rebates and competition with out-of-pocket coinsurance in Medicare Part D, 2014 to 2018. JAMA network open. 2021;4(5):e219030-e219030.
- Hernandez I, San-Juan-Rodriguez A, Good CB, Gellad WF. Changes in list prices, net prices, and discounts for branded drugs in the US, 2007-2018. Jama. 2020;323(9):854-862.
- Helland E, Seabury SA. Are settlements in patent litigation collusive? Evidence from Paragraph IV challenges. National Bureau of Economic Research; 2016.
- AbbVie Receives U.S. FDA Approval of VIEKIRA PAK™ (Ombitasvir/Paritaprevir/Ritonavir Tablets; Dasabuvir Tablets) for the Treatment of Chronic Genotype 1 Hepatitis C [press release]. December 19, 2014 2014.
- Armstrong AGM. The obesity pipeline was ‘late breaking.’ Here’s what the R&D landscape looks like now. Fierce Biotech. March 6, 2025, 2024;Mar 19, 2024.
- Wang L, Wang N, Zhang W, et al. Therapeutic peptides: current applications and future directions. Signal Transduction and Targeted Therapy. 2022;7(1):48.
- Ward AS, Tysinger B, Nguyen P, Goldman D, Lakdawalla D. Benefits of Medicare Coverage for Weight Loss Drugs. 2023.
- Lakdawalla DN, Doctor JN. A principled approach to non-discrimination in cost-effectiveness. The European Journal of Health Economics. 2024:1-24.
- Lakdawalla DN, Phelps CE. A guide to extending and implementing generalized risk-adjusted cost-effectiveness (GRACE). The European Journal of Health Economics. 2022;23(3):433-451.
- Institute for Clinical and Economic Value Review. Value Assessment Framework 2023. https://icer.org/wp-content/uploads/2023/09/ICER_2023_VAF_For-Publication_092523.pdf. Accessed March 21, 2025.
- Cook W. Using the internal rate of return in public sector project evaluations. Canadian Journal of Program Evaluation. 1989;4(2):11-21.
- Rodriguez PJ, Cartwright BMG, Gratzl S, et al. Semaglutide vs tirzepatide for weight loss in adults with overweight or obesity. JAMA Internal Medicine. 2024;184(9):1056-1064.
- Baig K, Dusetzina SB, Kim DD, Leech AA. Medicare Part D Coverage of Antiobesity Medications—Challenges and Uncertainty Ahead. The New England Journal of Medicine. 2023.
- Kabiri M, Sexton Ward A, Ramasamy A, et al. The societal value of broader access to antiobesity medications. Obesity. 2020;28(2):429-436.
- García JL, Heckman JJ, Leaf DE, Prados MJ. Quantifying the life-cycle benefits of an influential early-childhood program. Journal of Political Economy. 2020;128(7):2502-2541.
- System BoGotGR. Financial Accounts of the United States – Z.1. Current Release Web site. https://www.federalreserve.gov/releases/z1/20241212/html/recent_developments.htm. Published 2024. Accessed December 20, 2024.