Schaeffer Center White Paper Series | DOI: 10.25549/0af1-jd60
Cite: (.enw, .ris)
Policy Context
The Medicare Part D program provides prescription drug insurance for more than 53 million Americans. While the original Part D benefit—first available in 2006—left many beneficiaries exposed to high out-of-pocket costs, subsequent policy changes attempted to improve benefit generosity. Despite these changes, many beneficiaries continued to face challenges with prescription drug affordability.
The Inflation Reduction Act (IRA), passed in 2022, includes several provisions intended to reduce patient spending on prescription drugs, including a $2,000 annual out-of-pocket cap that took effect in 2025. We analyze trends in Part D benefit design to understand how plans are responding to their increased financial responsibility under the program’s changing requirements.
Our research shows that plans have substantially increased beneficiary cost-sharing exposure through increases in deductibles and shifts to coinsurance structures that tie beneficiary costs to list prices. While these trends have occurred in stand-alone Part D plans since at least 2020, we find they accelerated in Medicare Advantage Prescription Drug plans (MA-PDs) in 2025. Among MA-PDs, average deductibles increased from $62 in 2024 to $224 in 2025, while the share of enrollment in plans with coinsurance for preferred brand drugs increased from 2.6% to 27.5%. These findings suggest that, while the small share of beneficiaries who reach the cap will avoid high out-of-pocket costs, most beneficiaries may actually see their out-of-pocket costs increase due to these changes in plan design, including increased exposure to high list prices. As Medicare’s drug price negotiations begin affecting select medications in 2026, policymakers should monitor whether IRA reforms are achieving a primary goal—reducing beneficiary drug costs—and assess their impacts on the Part D market.
Key Takeaways
- The Inflation Reduction Act introduced significant changes to the Medicare Part D standard benefit design in 2025, including a $2,000 out-of-pocket cap.
- The out-of-pocket cap provides important insurance protection for beneficiaries, but other Inflation Reduction Act changes incentivized plans to increase beneficiary exposure to cost sharing prior to reaching the cap.
- Stand-alone Part D plans have increased beneficiary cost sharing through higher deductibles and the use of coinsurance, rather than copayments. This trend started in 2020 and continued with the Inflation Reduction Act’s changes in 2025.
- Prior to 2025, most Medicare Advantage Prescription Drug plans had no drug deductible, and very few used coinsurance. However, in 2025, these plans considerably increased deductibles and switched from copayments to coinsurance.
- Policymakers should evaluate the Inflation Reduction Act’s impact on cost sharing at the pharmacy counter, especially since deductibles and coinsurance expose patients to list prices, which do not reflect manufacturer rebates and other price concessions.
A press release covering this white paper’s findings is available here.
Abstract
The Inflation Reduction Act (IRA) caps Medicare Part D prescription drug out-of-pocket (OOP) costs at $2,000 starting in 2025. However, most beneficiaries do not reach the OOP cap, and other aspects of Part D benefit design could increase their cost-sharing burden. Between 2020 and 2024, stand-alone Medicare Prescription Drug Plans (PDPs) were switching from copayment to coinsurance for preferred brands, thereby shifting cost sharing to beneficiaries. During the same time, Medicare Advantage Prescription Drug plan (MA-PD) formularies had lower and more predictable OOP costs, offering more zero-deductible plans and a high proportion with copayment for preferred brands. With the introduction of the $2,000 OOP cap in 2025, MA-PDs started to look more like PDPs, shifting cost sharing to beneficiaries with fewer zero-deductible plans and greater proportions with coinsurance for preferred brands and non-preferred drugs. In theory, beneficiaries who did not expect to hit the OOP cap could have benefited from shopping around for their 2025 plan. However, many would have found fewer options for plans with copayments and reduced deductibles. The burden of high drug prices increasingly falls on beneficiaries, especially as cost sharing is more pervasively tied to list prices through deductibles and coinsurance.
List of acronyms
AE: Actuarially equivalent
CMS: Centers for Medicare & Medicaid Services
ICL: Initial coverage limit
IRA: Inflation Reduction Act
MA-PD: Medicare Advantage Prescription Drug plan
OOP: Out-of-pocket
PDP: Stand-alone Medicare Prescription Drug Plan
PUF: Public Use File
Introduction
Medicare beneficiaries choose a Part D plan for prescription drug coverage annually, although few beneficiaries switch plans.1 Beneficiaries are advised to shop around because Part D plans have different benefit designs. For example, coinsurance (an out-of-pocket (OOP) obligation based on a percentage of a drug’s list price) vs. copayment (a flat fee) generally shifts a greater proportion of drug costs to beneficiaries, especially for highly rebated drugs.2
Indeed, in previous work, we found that monthly OOP spending for Eliquis—the top-grossing drug in Medicare Part D—averaged $39–$46 when Part D plans used copayments versus $92–$121 when plans used coinsurance.2 The difference reflects the fact that coinsurance ties OOP spending to list prices, which are often highly inflated as they do not reflect manufacturer rebates. For Eliquis, such rebates averaged 45%–50% off the list price in 2023.3,4 These patterns are consistent across other commonly used branded drugs, and the high OOP spending that ensues is concerning because it creates affordability challenges, reduces adherence and worsens health outcomes.5 Moreover, when beneficiaries don’t share in rebates at the pharmacy counter, they effectively subsidize premiums for other beneficiaries.
While the Part D program includes a “standard benefit design” with parameters updated annually, in practice there is a lot of variation across plans in components like premiums, deductibles, and formularies placing drugs on tiers with defined copayment or coinsurance. Although the Centers for Medicare & Medicaid Services (CMS) dictates a range of drugs that must be included on plan formularies (i.e., protected classes), it does not generally specify their placement on cost-sharing tiers.a Plans may use this flexibility strategically by placing drugs with generic alternatives or in protected classes on high cost-sharing tiers to discourage use. Alternatively, placing branded drugs on low cost-sharing tiers could encourage enrollment of select beneficiaries who use those products.7,8
The Inflation Reduction Act (IRA), passed in 2022, includes several provisions that have impacted Part D plan design and cost sharing. For the first time, CMS will set prices for select drugs, with prices for the 10 initially selected drugs taking effect in 2026. Another key change that took effect at the beginning of 2025 redesigned the Part D standard benefit to include a $2,000 OOP cap and eliminate the former “coverage gap.”9,10 While these benefit design changes provide important insurance protection for all beneficiaries, only a minority are directly affected. For example, among Part D beneficiaries who do not receive low-income subsidies, previous modeling found that only about 5% would reach a $2,000 OOP cap, while about half would not exit the deductible under the standard benefit.11 Additionally, while a goal of the IRA was to lower prescription drug costs and improve prescription drug insurance affordability, early analysis of 2025 Part D plan designs reported fewer plan choices and higher premiums.12
Given the importance of understanding both the real-world and distributional consequences of the IRA’s changes, we examined trends in Part D benefit design between 2020 and 2024 and compared them to changes between 2024 and 2025 as the IRA’s benefit redesign and $2,000 OOP cap were implemented. While the IRA itself may have been intended to reduce costs for the federal government and beneficiaries, the realized impact of the IRA for beneficiaries will depend on how plans react. To assess these changes, our analysis focused on deductibles, tier-level cost sharing and tier placement of drugs with high Part D spending. Additionally, we compared trends between stand-alone Medicare Part D Plans (PDPs) and Medicare Advantage Prescription Drug plans (MA-PDs). Drug-level utilization management such as step therapy, prior authorization and quantity limits were not considered but warrant further study. We also did not account for cost-sharing subsidies provided to low-income beneficiaries.
Methods
This descriptive analysis used CMS Public Use Files (PUFs) including formularies,13 plan benefit package information14 and enrollment.15 Formularies provided cost-sharing information by plan and tier; plan benefit package information provided benefit design and tier descriptions. Files were selected to represent the beginning of each calendar year 2020 to 2025 and were supplemented with drug information from First Databank and aggregate spending from the CMS Part D spending dashboard.16
Part D plans were categorized by plan type (MA-PDs vs. PDPs) and benefit generosity (basic/actuarially equivalent (AE) vs. enhanced). Enhanced benefit design offers more generous coverage than basic or AE plans, typically in exchange for supplemental premiums. Special Needs Plans, plans using the Defined Standard drug benefit, and plans without PUF formulary and/or plan benefit package information (e.g., Employer Group Waiver Plan, Program of All-Inclusive Care for the Elderly) were excluded.
As part of cost sharing with a Part D plan, beneficiaries may be responsible for a yearly deductible (standard deductible in 2025 = $590, which may be reduced to as low as $0 by some plans). Generally, after the deductible is met, the plan then pays for a portion of covered drugs. The other portion is typically paid by some combination of the patient, drug company and federal government. Part D plans use formularies to categorize drugs by tiers with common cost-sharing characteristics (e.g., Tier 1 preferred generics, Tier 2 generics, Tier 3 preferred brands, Tier 4 non-preferred drugs, Tier 5 specialty drugs). Tier-level cost-sharing characteristics may vary by benefit coverage phase, days’ supply and pharmacy type (retail vs. mail order, preferred vs. non-preferred). For this analysis, we chose the lowest tier a drug (by generic name) appeared on and assumed a 30-day supply filled at a preferred retail pharmacy during the pre-initial coverage limit (ICL) (2020–2024) or ICL (2025) phase of coverage.b
We calculated the proportion of plans with basic/AE vs. enhanced benefit design and average deductibles by plan type (MA-PD vs. PDP) weighted by enrollment. If actual enrollment was not available, plans with masked enrollment (enrolled fewer than 11 beneficiaries) were assigned a weight of 1; plans with missing enrollment were assigned a weight of 0. For the most common tiers, we further calculated the proportion of plans by cost-sharing type (copayment vs. coinsurance) and tier description as well as the mean copayment and/or percentage coinsurance by plan type (MA-PD vs. PDP), also weighted by enrollment. These analyses were also repeated by benefit generosity (basic/AE vs. enhanced). To provide further information about the breadth and type of drugs covered on each tier, we reported the number of drugs (by generic name) and the top drugs by aggregate spending with ≥50% of beneficiaries covered on the tier (≥20% for Tier 6).
All analyses were conducted using SAS v9.4 (SAS Institute Inc., Cary, NC). Deductibles and copayments are shown in nominal U.S. dollars.
Results
Plan characteristics
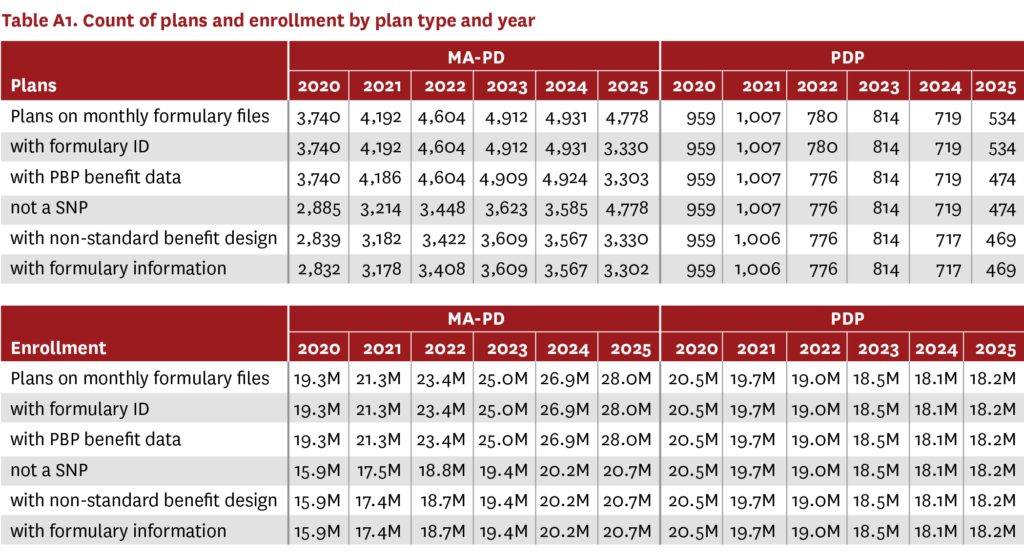
The analysis included information for 3,302 MA-PDs covering over 20 million beneficiaries in 2025 (up from 2,832 MA-PDs and over 15 million beneficiaries in 2020), and 469 PDPs covering over 18 million beneficiaries in 2025 (down from 959 PDPs and over 20 million beneficiaries in 2020) (table A1). Almost all MA-PDs (99%) and an increasing proportion of PDPs (2020: 45%, 2024: 61%) offered enhanced Part D benefits (figure A1). However, the proportion of PDPs offering enhanced Part D benefits decreased in 2025 (57%).

Trends in MA-PD and PDP benefit design 2020–2024 vs. 2025
Deductibles
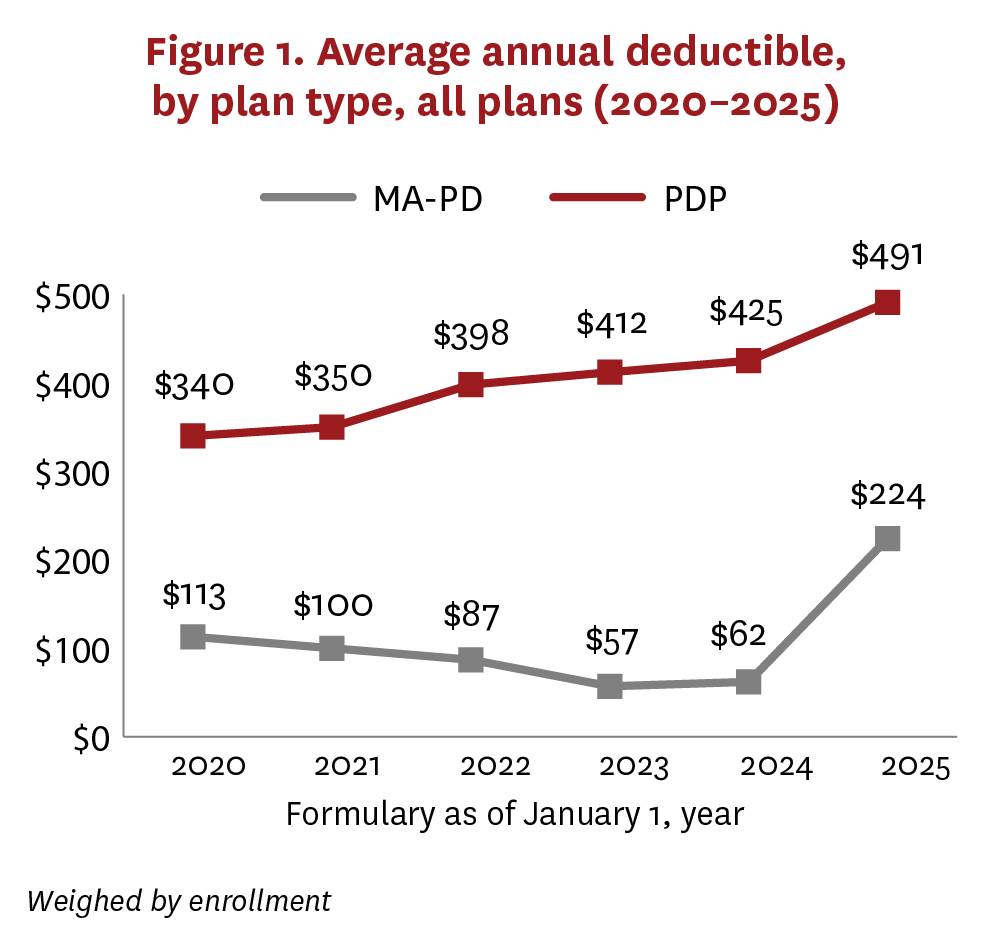
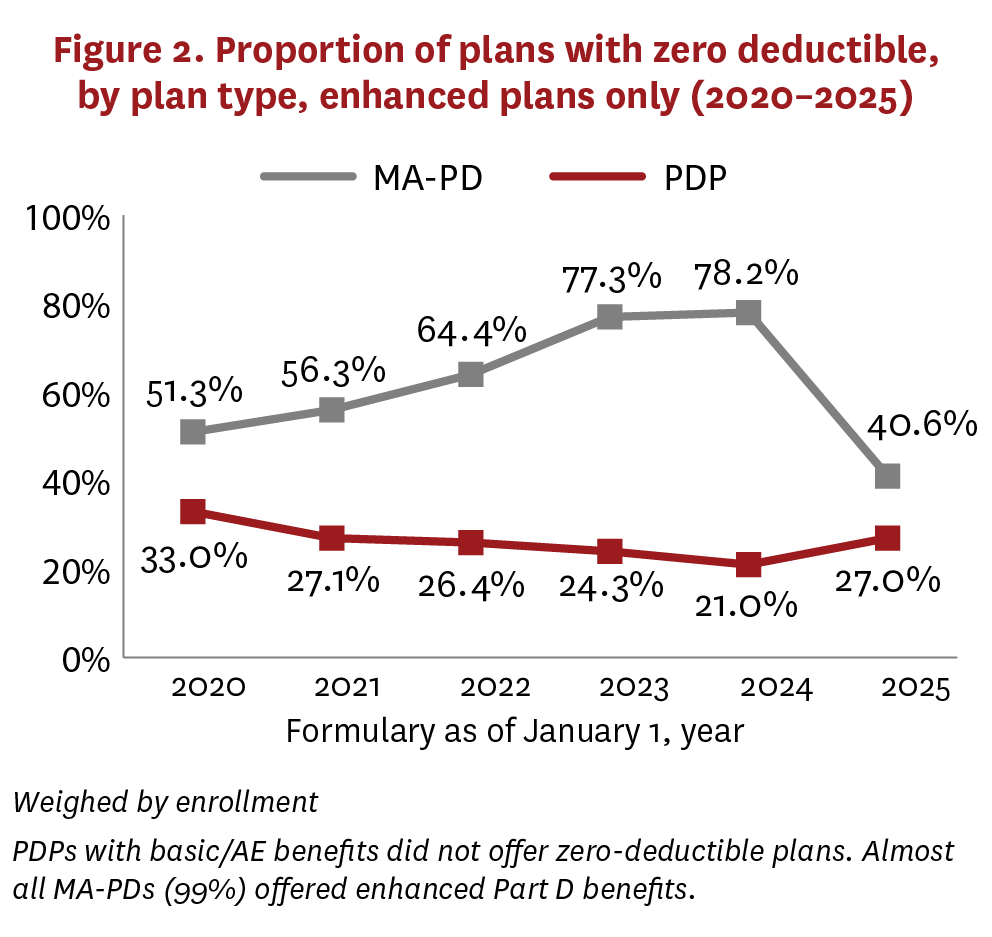
From 2020 to 2024, average deductibles increased from $340 to $425 for PDPs, while decreasing for MA-PDs from $113 to $62 (figure 1). In 2025, the average deductible for PDPs continued to increase gradually ($491), while MA-PDs reversed their trend and demonstrated a sharp increase ($224). In all years, average deductibles were higher among basic/AE PDPs than enhanced PDPs, but the trends were similar (figure A2). The change in average deductibles for MA-PDs in 2025 was largely driven by a sharp decrease in the proportion of plans with zero deductible (figure 2). Although PDPs demonstrated a similar relationship between 2020 and 2024 (average deductible moving counter to the proportion of plans with zero deductible), this changed in 2025, when the PDP average deductible increased alongside an increase in the share of enhanced plans offering zero deductible. This change was mostly due to increases in average deductibles (figure A2), along with an enrollment shift to PDPs with basic/AE benefits, which did not offer zero-deductible plans.

Formulary tiers
The first five formulary tiers for most MA-PDs (≥97%) and PDPs (≥99%) were: 1 preferred generics, 2 generics, 3 preferred brands, 4 non-preferred drugs/brands and 5 specialty drugs.
Tiers 1 and 2, which typically covered generics with a low copayment (<$10 average), were similar across MA-PDs and PDPs. However, MA-PDs commonly covered a larger number of drugs on Tiers 1 and 2 compared to PDPs (tables A2–A13). In some cases, a drug that had a generic available and was covered on Tiers 1 or 2 by MA-PDs was more commonly covered as a branded product on Tier 3 by PDPs, leading to higher potential cost sharing for PDP beneficiaries. No noticeable changes occurred in 2025 for Tiers 1 and 2 for either plan type.
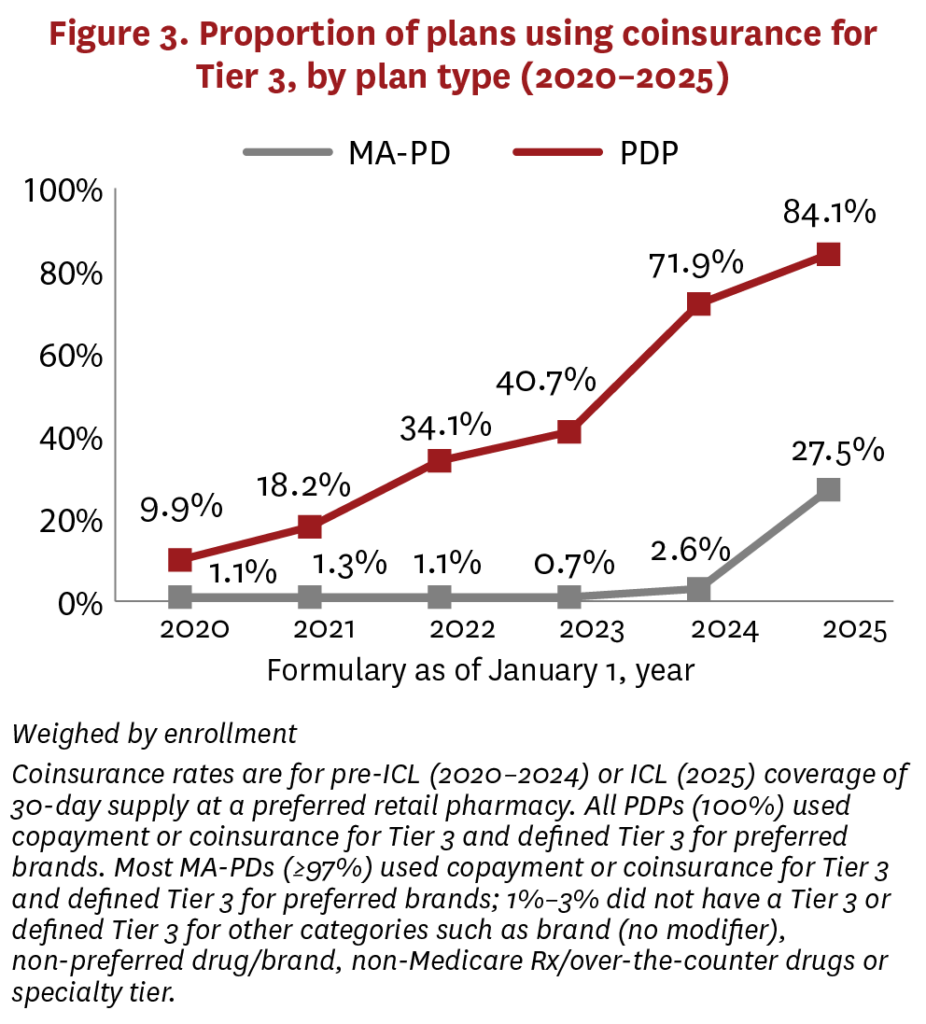
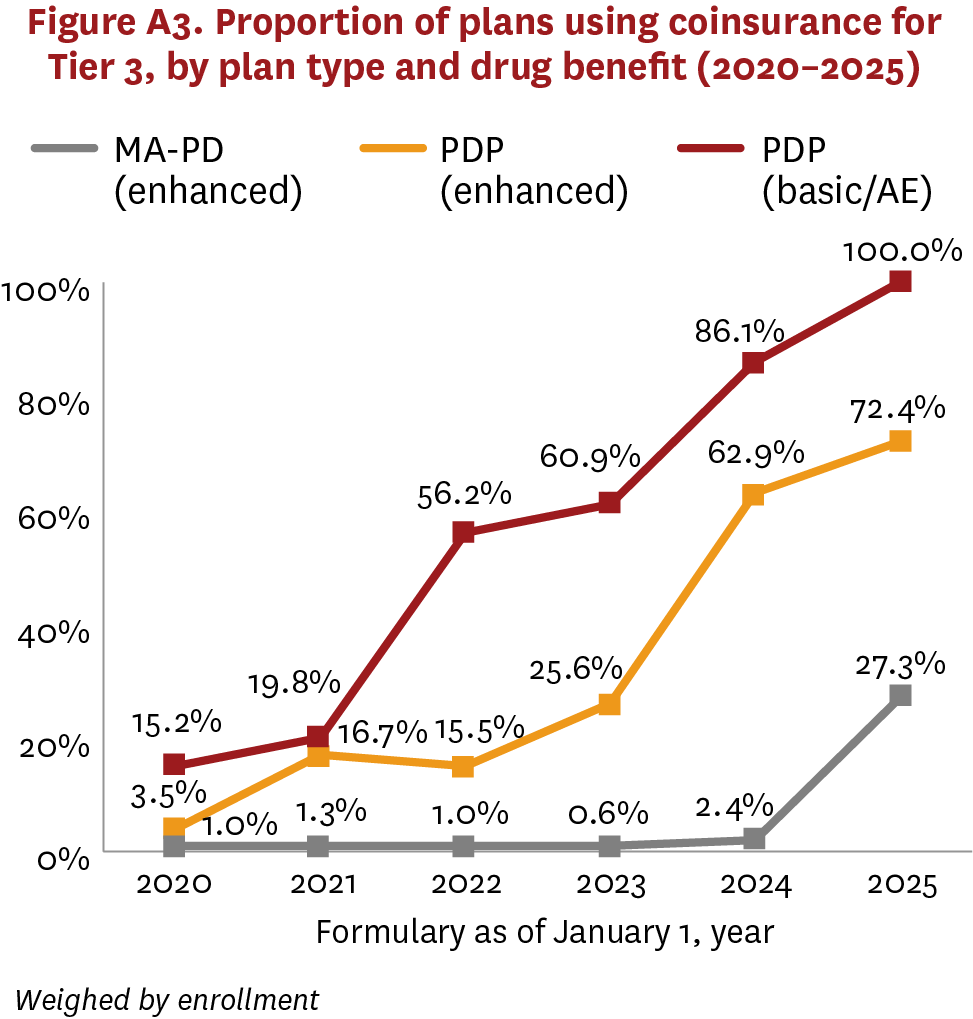
MA-PDs and PDPs had greater variation on Tier 3, which typically covered preferred brand drugs using higher cost sharing ($40–$46 average copayment, 16%–23% coinsurance rate) vs. generics. Although MA-PDs rarely used coinsurance for Tier 3 between 2020–2024, PDPs have been increasing their use of coinsurance, switching from copayment, over the same period (figure 3, figure A3). But in 2025, the share of MA-PDs using coinsurance increased sharply, from 2.6% to 27.5%.
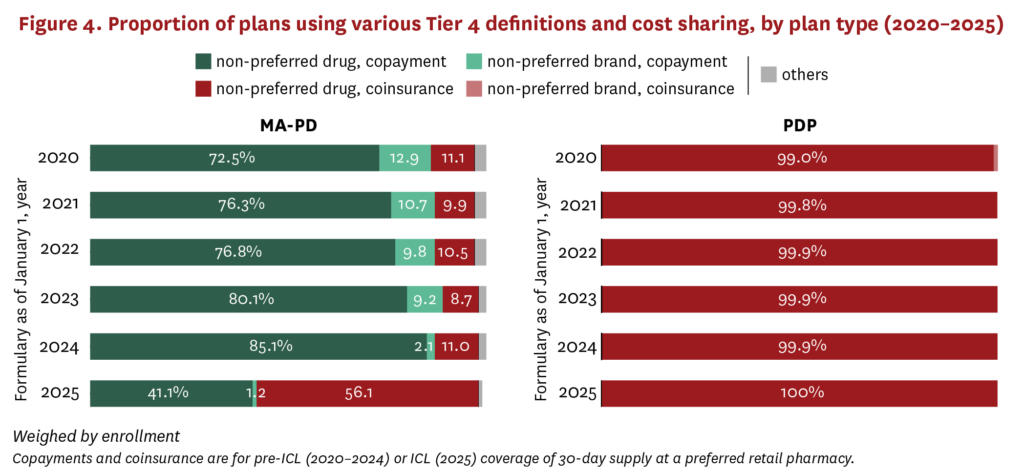
While PDPs were making changes to Tier 3 over the last several years, MA-PDs were changing coverage on Tier 4, which typically covered non-preferred drugs (including some generics) with even higher cost sharing ($91–$98 average copayment, 39%–45% coinsurance rate) compared to lower tiers. MA-PDs more frequently used copayment on Tier 4 between 2020 and 2024, while increasing their use of the term non-preferred drugs rather than non-preferred brands to describe the tier (figure 4). In 2025, there was a marked shift among MA-PDs from copayments to coinsurance for non-preferred drugs on Tier 4, with coinsurance increasing from 11.0% of plans in 2024 to 56.1% of plans in 2025. PDPs have consistently used Tier 4 for non-preferred drugs with coinsurance.
Differences in formularies for Tier 4 drugs generally favored MA-PDs compared to PDPs. In some cases, a drug commonly covered on Tier 4 among PDPs was covered as a preferred brand on Tier 3 by MA-PDs, leading to lower cost sharing for MA-PD beneficiaries. In other cases, a drug commonly covered on Tier 4 by PDPs was covered as a specialty drug on Tier 5 by MA-PDs, also leading to lower cost sharing for MA-PD beneficiaries, because coinsurance rates on Tier 4 tend to be lower than those used on Tier 5 (MA-PDs: 30%–32% average coinsurance; PDPs: 26%–27% average coinsurance) (figures A4, A5)


Discussion
The IRA’s Part D benefit redesign represents a significant change for Medicare beneficiary cost-sharing burden. On one hand, certain beneficiaries with a high degree of spending on medicines in both PDPs and MA-PDs saw their OOP expenditures limited to $2,000 in 2025, down from approximately $3,300–$3,800 in 2024 and unlimited in years prior.18 This OOP cap provides important insurance protection for all beneficiaries and directly reduces OOP spending among the minority of beneficiaries who will reach the cap.c On the other hand, Part D benefit design changes in 2025 will likely increase OOP spending for most beneficiaries.
This increase stems from two major shifts in Part D benefit design: increased deductibles (largely driven by fewer zero-deductible plans) and increased use of coinsurance instead of copayment. Average deductibles increased from 2024 to 2025 among both PDPs and MA-PDs. While this shift followed trends from 2020 to 2024 among PDPs, the proportion of MA-PDs with zero deductible sharply decreased in 2025, a clear break from trends in earlier years, exposing beneficiaries to higher OOP costs.
Unlike a copayment, coinsurance exposes a beneficiary to a percentage of the drug’s list price before most rebates and discounts.21 PDPs have been switching to coinsurance since at least 2020. However, 2025 marked a notable increase in MA-PDs using coinsurance for preferred brands and non-preferred drugs. Prior work has shown that this switch from copayment to coinsurance meaningfully increases patient OOP costs for common preferred brand drugs.2 More generally, through much greater use of deductibles and coinsurance across the market, beneficiaries are now highly exposed to distortions from cost sharing tied to undiscounted list prices.
The calculation of the IRA’s $2,000 OOP cap further complicates the dynamic between plans and beneficiaries. Under the IRA, a beneficiary reaches the $2,000 OOP cap based on the OOP spending that would have occurred under the standard benefit design even if they are in a plan with an enhanced structure or lower deductible.22 For example, a beneficiary in a zero-deductible plan would receive a $590 “credit” (i.e., amount of deductible in the standard benefit design) toward the $2,000 OOP cap even though they pay far less. The Part D design shift toward higher deductibles and use of coinsurance is likely a response to the structure of this calculation. While such a structure may be necessary to ensure that beneficiaries have the option to trade off potentially higher premiums for reduced OOP costs through enhanced coverage, plan choice is likely at risk—particularly choice of plans using copayments rather than coinsurance and reduced deductibles.
Our analysis has some limitations. Ideally, changes to formulary design would be assessed together to determine the cumulative impact on beneficiary cost sharing. Additionally, prior to closure of the coverage gap, a 25% coinsurance rate was used for all spending during the gap and 5% coinsurance during the catastrophic phase of coverage. It is unclear how this would impact cost sharing without processing individual claims data, though we expect such an analysis would produce a similar conclusion—namely, a small subset of beneficiaries pay less OOP under benefit redesign (sometimes much less) while most beneficiaries pay more. We used the CMS PUF formularies because they are published several years ahead of Medicare claims, which would be required to analyze real-world beneficiary-level data. Additionally, we do not account for the fact that beneficiaries with low-income subsidies face reduced cost-sharing amounts.
Moreover, we did not assess the potential impact on cost sharing of drugs with prices set under the CMS negotiation process, which will first take effect for select drugs in 2026. Because the prices set by CMS are notably lower than the drugs’ list prices, beneficiary cost sharing will also likely decrease relative to 2025, since it will be tied to prices much closer to net than list price for this subset of drugs. However, even for a drug like Eliquis, 21%–23% coinsurance (average coinsurance rate in 2025 for Eliquis) off the 2026 price of $231 per 30-day supply as determined by CMS (or $49–$53 OOP per month) is higher than the average $39–$46 copayments between 2020 and 2025.
Finally, we did not assess premiums or track changes within plans over time in this analysis. Comparing premiums across PDPs and MA-PDs is complicated by data limitations. Most MA plans “buy down” the Part D premium on behalf of their beneficiaries, with data on the buy-down amount unavailable at the plan level. Additionally, PDPs were eligible for the Part D Premium Stabilization Demonstration, which provided additional premium subsidies to PDPs only.
Conclusion
The IRA introduced major changes to Medicare Part D benefit design. Although the OOP cap is an important protection for beneficiaries, its implementation incentivized plans to increase beneficiary exposure to cost sharing prior to reaching that limit. This shift has been occurring among PDPs since at least 2020, but there has been an abrupt change in 2025 among MA-PDs. As a result, most Part D beneficiaries are likely seeing higher OOP costs in 2025 than they did in previous years. The cost sharing that beneficiaries face at the pharmacy counter can result in prescription abandonment and low treatment adherence, underscoring the need for policies that ensure beneficiaries benefit from rebates and discounts at the pharmacy counter.
Footnotes
a. CMS does sometimes restrict which products can be placed on certain tiers. For example, drugs must meet certain monthly list-price requirements to be eligible to be placed on a specialty tier, and CMS requires that at least one product in a class be on a preferred tier.6
b. With the elimination of the “coverage gap” phase in 2025, the ICL in 2025 most closely maps to the pre-ICL phase in 2020–2024.
c. Additional smoothing provisions may help stabilize cost sharing throughout the year, although uptake has been limited.19 However, OOP costs may become less predictable for beneficiaries who opt in to smoothing provisions but do not reach the OOP cap.20
References
- Biniek, J., A. Damico, J. Cubanski and T. Neuman. (2022). Medicare Beneficiaries Rarely Change Their Coverage During Open Enrollment. Kaiser Family Foundation, November 1. https://www.kff.org/medicare/issue-brief/medicare-beneficiaries-rarely-change-their-coverage-during-open-enrollment.
- Trish, E., B. Blaylock and K. Van Nuys. (2025). Cost Sharing for Preferred Branded Drugs in Medicare Part D. JAMA, 333 (13): 1170-72.
- Anderson-Cook, A., and R. Frank. (2024). Impact of Federal Negotiation of Prescription Drug Prices. Brookings, August 19. https://www.brookings.edu/articles/impact-of-federal-negotiation-of-prescription-drug-prices.
- Hernandez, I., O. J. Wouters, E. M. Cousin, A. S. Kirihennedige and S. D. Sullivan. (2024). Interpreting the First Round of Maximum Fair Prices Negotiated by Medicare for Drugs. Health Affairs Forefront, September 3. https://www.healthaffairs.org/content/forefront/interpreting-first-round-maximum-fair-prices-negotiated-medicare-drugs.
- Goldman, D. P., G. F. Joyce and Y. Zheng. (2007). Prescription Drug Cost Sharing: Associations With Medication and Medical Utilization and Spending and Health. JAMA, 298 (1): 61-69.
- Centers for Medicare & Medicaid Services. (2016). Chapter 6 – Part D Drugs and Formulary Requirements. Medicare Prescription Drug Benefit Manual. https://www.cms.gov/Medicare/Prescription-Drug-Coverage/PrescriptionDrugCovContra/Downloads/Part-D-Benefits-Manual-Chapter-6.pdf.
- Geruso, M., and T. J. Layton. (2017). Selection in Health Insurance Markets and Its Policy Remedies. Journal of Economic Perspectives, 31 (4): 23-50.
- Lavetti, K., and K. Simon K. (2018). Strategic Formulary Design in Medicare Part D Plans. American Economic Journal: Economic Policy, 10 (3): 154-92.
- Centers for Medicare & Medicaid Services. (2024). Final CY 2025 Part D Redesign Program Instructions Fact Sheet. April 1. https://www.cms.gov/newsroom/fact-sheets/final-cy-2025-part-d-redesign-program-instructions-fact-sheet.
- Centers for Medicare & Medicaid Services. (2022). The Inflation Reduction Act Lowers Health Care Costs for Millions of Americans. October 5. https://www.cms.gov/priorities/legislation/inflation-reduction-act-and-medicare/lowers-health-care-costs-millions-americans.
- Trish, E., K . M. Kaiser, J. Celestin and G. Joyce. (2022). Reforming the Medicare Part D Benefit Design: Financial Implications for Beneficiaries, Private Plans, Drug Manufacturers, and the Federal Government. Journal of Health Politics, Policy and Law, 47 (6): 853-77.
- Cubanski, J., and A. Damico. (2024). Medicare Part D in 2025: A First Look at Prescription Drug Plan Availability, Premiums, and Cost Sharing. Kaiser Family Foundation, November 22. https://www.kff.org/medicare/issue-brief/medicare-part-d-in-2025-a-first-look-at-prescription-drug-plan-availability-premiums-and-cost-sharing.
- Centers for Medicare & Medicaid Services. (2025). Monthly Prescription Drug Plan Formulary and Pharmacy Network Information. https://data.cms.gov/provider-summary-by-type-of-service/medicare-part-d-prescribers/monthly-prescription-drug-plan-formulary-and-pharmacy-network-information.
- Centers for Medicare & Medicaid Services. (2025). Benefits Data. https://www.cms.gov/data-research/statistics-trends-and-reports/medicare-advantagepart-d-contract-and-enrollment-data/benefits-data.
- Centers for Medicare & Medicaid Services. (2025). Monthly Enrollment by Plan. https://www.cms.gov/data-research/statistics-trends-and-reports/medicare-advantagepart-d-contract-and-enrollment-data/monthly-enrollment-plan.
- Centers for Medicare & Medicaid Services. (2022). Medicare Part D Spending by Drug. https://data.cms.gov/summary-statistics-on-use-and-payments/medicare-medicaid-spending-by-drug/medicare-part-d-spending-by-drug.
- Axelsen, K., R. Portman, M. Martin, H. Jeppson and A. Zheng. (2025). Medicare Drug Price Negotiation: Saving Money for Medicare, but What About Patients? DLA Piper, March 28. https://www.dlapiper.com/en/insights/publications/2025/03/medicare-drug-price-negotiation-saving-money-for-medicare-but-what-about-patients.
- Centers for Medicare & Medicaid Services. (2025). Lower Out-of-Pocket Drug Costs in 2024 and 2025. https://www.cms.gov/files/document/lower-out-pocket-drug-costs-2024-and-2025-article.pdf.
- Duke D, Cline M, Liner D. (2025). MedIntel Insights: Early Look at Medicare Prescription Payment Plan Enrollment. https://www.milliman.com/en/insight/medintel-insights-early-look-m3p-enrollment.
- Dusetzina, S. B., A. D. Zuckerman, N. L. Keating and H. A. Huskamp. (2024) Medicare Part D’s New Prescription Payment Plan May Not Reduce Costs for All. Health Affairs Forefront, February 8. https://www.healthaffairs.org/content/forefront/medicare-part-d-s-new-prescription-payment-plan-may-not-reduce-costs-all.
- Lakdawalla, D., and M. Li. (2021). Association of Drug Rebates and Competition With Out-of-Pocket Coinsurance in Medicare Part D, 2014 to 2018. JAMA Network Open, 4 (5): e219030.


