Schaeffer Center White Paper Series | DOI: 10.25549/w413-nf29
Cite: (.enw, .ris)
Summary
This paper introduces two accounting frameworks for reporting revenues in financial statements—known as the principal and agent models—and explores their implications for pharmacy benefit manager (PBM) profitability. We then extend these frameworks to a more contemporary accounting and market environment to reflect extensive vertical integration in the pharmaceutical supply chain. The results suggest that the historically low profit margins in the PBM industry result from discretionary accounting practices that allow recognition of pass-through payments rather than a competitive PBM marketplace.
Key Takeaways
- PBM profit margins may be misleading due to accounting choices. Current accounting rules allow PBMs to choose whether to count pass-through payments (like rebates) as revenue – a choice that can make their profit margins appear artificially low without affecting actual profitability.
- Vertical integration hides where profits are generated. As major PBMs have merged with insurers and pharmacies, their financial results are bundled together in broad business segments. This limits the degree to which research can be conducted on PBM profitability.
- Low margins don’t necessarily mean fierce competition. When the same PBM business can show either razor-thin or robust margins depending solely on accounting treatment, reported margins become unreliable indicators of market competitiveness or efficiency.
A press release covering this white paper’s findings is available here.
Policy Context
The PBM market has become increasingly consolidated, with the top three PBMs now controlling nearly 80% of the U.S. prescription drug market. Some argue that PBM reform might have a limited impact on drug prices or insurance companies that contract with PBMs because PBMs already operate at relatively low profit margins. This paper adds to the policy discussion by exploring how accounting practices could potentially mask the true profitability of PBMs by presenting three stylized examples, one of which considers the additional role of vertical integration. We suggest the following policy considerations:
- Implement financial reporting transparency reform that addresses pass-through payments and revenue sources: A requirement for PBMs to report revenues net of pass-through payments would result in better insight into their profitability. However, as PBMs shift to a business model where more of their revenues are earned from fees rather than rebates or other pass-through payments, full visibility into PBM profitability drivers requires knowledge into the source of their income streams.
- Take vertical consolidation into account when developing PBM reforms: The largest PBMs are now part of extensive healthcare conglomerates, which means their financial reporting is aggregated into broader business segments containing other functions such as specialty pharmacy. Requiring more disaggregation of financial reporting would provide better transparency into PBM profitability for policymakers.
1. Introduction
The top three pharmacy benefit managers (PBMs) now control nearly 80% of the U.S. prescription drug market1 and manage hundreds of billions of dollars in prescription spending each year.[1] Despite this scale and influence, historically their reported profit margins have been strikingly low—typically between 4% and 7%.2[2,3] Low margins are generally suggestive of relatively inefficient operations, aggressive price competition or limited market power.[4–6] Theory also suggests that low margins, and the vigorous competition that drives them, result in more value accruing to consumers and less to shareholders. Notably, however, PBMs maintain slim margins with a high degree of market consolidation. This paradox has fueled a growing debate over PBMs’ apparent efficiency and whether it reflects a competitive, consumer-driven PBM marketplace or some other cause, perhaps related to accounting conventions that may obscure the level of economic profitability.[2,7]
Apart from concerns regarding market consolidation, policy debate around PBMs has largely focused on their lack of transparency, spread pricing and rebate practices, and the extent to which the aforementioned issues play a role in high drug prices.[1,8–16] Some argue that PBM reform might have a limited impact on drug prices or insurance companies that contract with PBMs because PBMs already operate at relatively low profit margins.[3,17,18] However, profitability is often linked to market power. Importantly, PBMs have used their historically low profit margins to minimize scrutiny from the Federal Trade Commission (FTC).[3] When the entities managing most of the nation’s drug spending appear less profitable than retail grocers, it raises a fundamental question: How do we reconcile PBM profit margins with other evidence of PBM market concentration and power?
McLean and Garis (2005) present a stylized example to demonstrate PBM profitability under Generally Accepted Accounting Principles (GAAP), which are the rules for how firms report revenues and expenses when preparing financial statements.[19] They then show that PBMs—which predominantly serve as middlemen that manage transactions between insurers and pharmacies—would have higher profitability rates if they followed an accounting reporting framework that better aligned with this role. This result stems from the fact that while the level of profits is the same irrespective of the chosen accounting principles, profit margins (i.e., the ratio of profits and revenue) are deflated when pass-through payments are recorded in financial statements. While McLean and Garis (2005) present a well-executed analysis of PBM accounting and profitability, their study was published in an era where the major PBMs operated as stand-alone companies. Furthermore, their financial presentation did not include an important role of PBMs: rebate negotiation.
This paper introduces the primary accounting concepts and their implications for PBM profitability following the simplified conceptual framework of McLean and Garis (2005). Next, we extend the conceptual framework to incorporate manufacturer rebates. Finally, we position financial flows within the contemporary accounting and market environment to reflect extensive vertical integration. Our analysis demonstrates that the profitability effects identified by McLean and Garis (2005) persist—and have arguably intensified—as vertical integration in the healthcare sector has led to PBMs becoming subsidiaries of diversified healthcare conglomerates that also own insurers, specialty pharmacies and rebate aggregators. By translating these accounting mechanics into a transparent framework, this paper provides clarity around how GAAP-compliant reporting can obscure the true economic returns of PBMs and motivation for potential reform in financial disclosures and oversight.3
The remainder of our paper is structured as follows. Section 2 provides a refresher on the flow of funds in the pharmaceutical supply chain and explains how these flows change with realistic vertical consolidation. Section 3 introduces key accounting principles and revenue recognition in a stylized PBM industry using conceptual diagrams to demonstrate the flow of funds. Section 4 expands these diagrams with illustrative accounting statements to show how different accounting frameworks interact with pharmacy and rebate pass-throughs and intercompany transactions in vertically integrated healthcare conglomerates. Finally, Section 5 concludes by summarizing the policy implications of PBM accounting and profitability and by providing direction for future research.
2. A Refresher on the Flow of Funds in the Pharmaceutical Supply Chain
Before examining the accounting treatment of PBM revenues, it is useful to revisit the flow of funds within the pharmaceutical supply chain. The reality is complex: Dollars move among manufacturers, wholesalers, pharmacies, insurers and PBMs through a mix of rebates, discounts and reimbursement arrangements that vary by product and payer. The purpose of this section is not to capture every contractual nuance but to clarify the broad financial relationships that underlie drug pricing. We first present the pharmaceutical supply chain in its traditional, horizontally organized form, then contrast it with the vertically integrated structures that now dominate the market. In both cases, we focus on the payments and other financial flows that get captured in financial statements.4
Figure 1 shows the financial flows in the pharmaceutical supply chain. This diagram clarifies the role of PBMs as intermediaries—they reimburse pharmacies on behalf of insurers and negotiate rebates with manufacturers on behalf of insurers. When the supply chain is horizontally organized, each stakeholder operates as a distinct company that files its own financial statements, providing visibility into its overall profitability. However, even in this context, specific transaction-level details remain opaque because individual financial flows are usually aggregated within total revenues or expenses rather than reported as separate line items. For PBMs, copay clawbacks—which can be a significant source of PBM revenue [24]—direct and indirect renumeration (DIR)5, and rebates are examples of flows obscured by aggregate reporting.
Figure 1. Pharmaceutical supply chain financial flows

When the supply chain becomes vertically integrated, the financial flows still represent real transfers of revenues and costs within a single corporate structure, but become less transparent externally because they are often invisible in consolidated financial reporting. Figure 2 demonstrates this in a supply chain where the vertically consolidated healthcare conglomerate includes the insurer/health plan, a PBM that owns a group purchasing organization (GPO) handling rebates and a specialty or mail-order pharmacy. All the financial flows from Figure 1 are present, but the orange arrows represent internal transfers between business segments of a single company. Another practical implication of vertical integration is that it may result in PBMs taking physical control of drugs, which can impact their accounting decisions. We will return to this issue in the next section.
Figure 2. Vertically integrated pharmaceutical supply chain financial flows
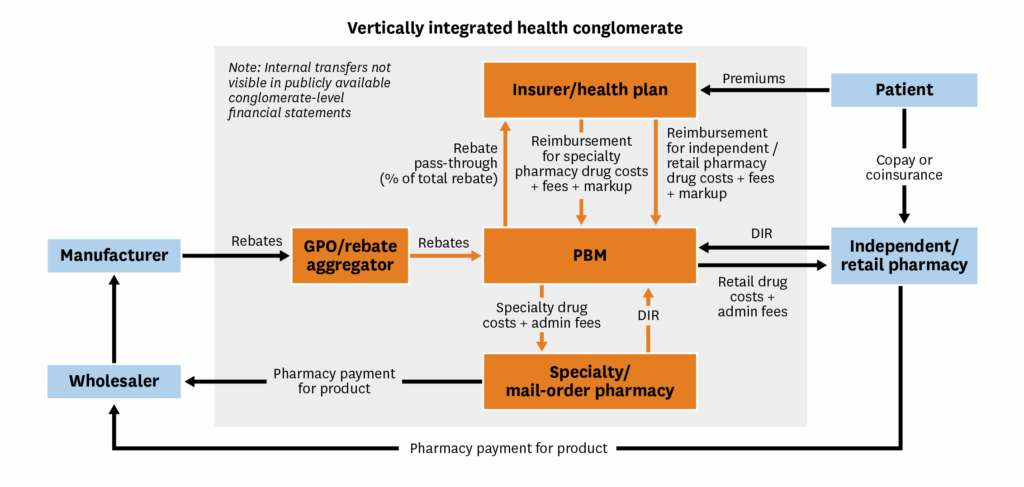
Although conglomerates sometimes report segment-level financial metrics, these segments often contain multiple functions (e.g., the PBM, GPO and specialty pharmacy are combined into a single reporting segment), which can mask the profitability of each component within a segment.
Additionally, our diagram does not capture forms of integration such as in-house healthcare providers (e.g., CVS Minute Clinic) and manufacturer subsidiaries (e.g., Quallant Pharmaceuticals) that are now common among major conglomerates. As support for these conclusions, in the appendix we provide a summary of vertical integration across the four major healthcare conglomerates (CVS, Cigna, UnitedHealth Group and Humana) and their financial structures.
3. Background: PBM Accounting Principles and Revenue Recognition
3.1. Simplified Conceptual Framework of PBM Transactions and Accounting
To introduce key accounting concepts in a simplified framework, we start by assuming PBMs perform a single function: serving as intermediaries between insurers/health plans and pharmacies.6 In particular, PBMs process prescription drug claims from pharmacies and obtain appropriate reimbursement from insurers. The basic conceptual framework with the flow of funds relevant to PBM accounting is shown in Figure 3.
Figure 3. Simplified conceptual framework for PBM accounting

In addition to the drug cost, the pharmacy may charge an administrative fee, which we illustrate as a per-prescription payment, though it could also be structured as a flat fee. This administrative fee is passed through to the insurer so that the total cost of each prescription (i.e., the total reimbursement amount) is the drug cost plus the administrative fee. In exchange for processing each claim, the PBM usually collects a transaction fee from the insurer. Additionally, the PBM may charge the insurer a markup on the total reimbursement amount, which generates revenue; this is also referred to as “spread pricing” for the PBM.7[28] The PBM keeps any transaction and markup fees from the insurer and transfers the drug reimbursement from the insurer to the pharmacy—these transfers are known as “pass-through payments” and are denoted by dashed lines in the figure.
To highlight how this conceptual framework can translate into different reported revenues (and therefore profit margins) for PBMs, we need to understand two different accounting frameworks that PBMs can use and their specific implications. Of particular relevance is the treatment of pass-through payments in financial reporting.
3.2. Overview of Accounting Standards and Revenue Reporting
All companies, regardless of industry (this includes PBMs and healthcare conglomerates), currently follow a unified approach to revenue recognition, outlined in Accounting Standards Codification (ASC) 606, which we revisit later in this section.[29] Prior to 2014, there were separate pieces of GAAP and industry-specific guidance, but the Financial Accounting Standards Board (FASB) had not issued specific guidance or regulations related to PBMs. As a result, PBMs historically drew guidance from EITF 99-19 and SAB 101 to justify their accounting methods.[19]
EITF 99-19 provided guidance on whether companies should report revenues on a gross or net basis, which we will refer to as the principal and agent frameworks, respectively.[30] In the PBM context, a principal framework implies that pass-through payments should be counted as revenues in financial statements. However, in the agent framework, any cash transfers between insurers and pharmacies that are managed by the PBM (i.e., pass-through payments) are not recognized as revenues of the PBM. In this framework, only transaction fees and markups are recorded as revenues. The differing treatment of revenues across these two frameworks ultimately affects public reports of firm profitability.
Whether PBMs should follow a principal or agent model under EITF 99-19 is less clear. In practice, a firm could justify using the principal framework by demonstrating that it assumed general risk from transactions.[31] This could include taking physical possession of goods (e.g., inventory risk), incurring credit risk (e.g., financial liability if the transaction failed), or having discretion in price setting. However, EITF 99-19 noted that these were qualitative indicators as opposed to a strictly enforced checklist, and ultimately the selected framework remained partly at the discretion of the firm.8[30] On the one hand, PBMs rarely physically handle the drugs sold in their pass-through transactions and thus would seem to fit the “agent” framework more closely. However, one could still justify a principal approach by asserting transactional or pricing risks—for example, by reimbursing pharmacies before receiving repayment from the insurer.9[32]
In 2014, the FASB introduced ASC 60610, which provided a unified framework for revenue recognition across all industries, including how to determine whether to take a principal or agent approach. Prior to ASC 606, firms had to demonstrate that they assumed “enough” risk to justify taking a principal approach. In comparison, under ASC 606, firms had to determine whether they controlled11 the good or service before it went to the customer.[31] While firms can still apply discretion under ASC 606, the control-based standard aimed to provide consistency across industries compared with the risk-based logic from previous GAAP standards.
In the case of PBMs, the concept of control is inherently ambiguous. The most intuitive interpretation of control would be a case in which PBMs physically take control of and store drugs on behalf of insurers, which in reality is rare unless a PBM is integrated with a pharmacy. Even though they do not own or store drugs for insurance beneficiaries, control can be interpreted to stem from PBMs’ ability to dictate where and how prescriptions are filled, since they can select which pharmacies are in-network or set formularies. Historically, PBMs have followed the principal framework for revenue recognition [2,19], which can inflate reported revenues by hundreds of billions of dollars annually given the scale of pass-through payments in the pharmaceutical supply chain (see appendix Table 4 for current revenue recognition statements for the major healthcare conglomerates).12 In practice, the choice of a principal framework shapes how PBM performance appears in financial statements and, by extension, how policymakers and analysts interpret their profitability. Moreover, the vertical integration of PBMs into healthcare conglomerates further complicates transparency in reported PBM margins. The next section illustrates these effects by linking the conceptual framework in Figure 3 with simplified accounting statements.
4. Accounting Conventions and Reported PBM Profitability: A Stylized Comparison of Principal and Agent Frameworks
We now illustrate the implications of accounting rules for reported profitability by means of a simple numerical example. We begin with the simplified conceptual framework as presented in Figure 3. Next, we expand it to incorporate rebates that reflect how PBMs manage pass-through payments between pharmacies and insurers, as well as between manufacturers and insurers.13 Finally, we explore the implications of the PBM as part of a vertically integrated healthcare conglomerate, which hides many of these pass-through payments from view in financial statements.
4.1. Comparison of Revenue Reporting Under a Simplified Framework
Figure 4 shows a more detailed version of the conceptual framework from Figure 3 including a full set of numeric assumptions. Next, we enter the various payments shown in Figure 4 into the PBM’s accounting statement under both the principal and agent frameworks (Table 1). Irrespective of the accounting framework, all payments denoted with blue arrows (non-pass-throughs) are recorded as revenue. Under the principal framework, pass-through payments from the insurer to the PBM are counted as revenues, and pass-through payments from the PBM to the pharmacy are recorded as expenses (costs). In contrast, under the agent model, pass-through payments are not recorded on the accounting statement because they simply represent cash flows between the insurer and the pharmacy, not revenues or expenses for the PBM.
Figure 4. Flow of funds for PBM accounting and assumptions (simplified framework)

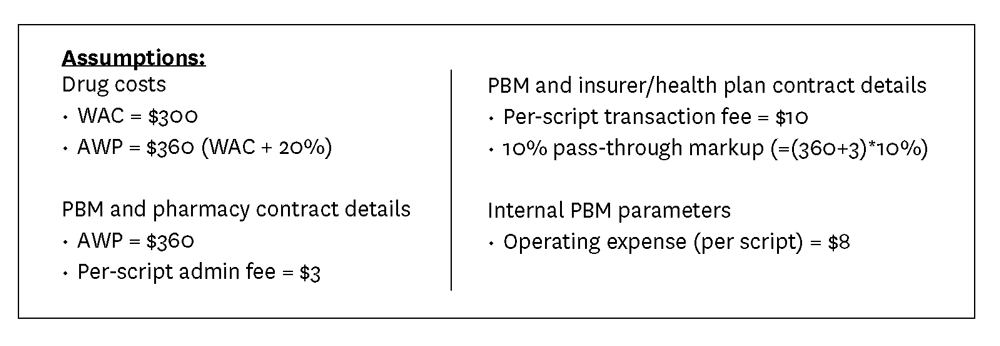
Table 1. PBM accounting statement (corresponds to framework and assumptions in Figure 4)

The choice of accounting framework does not affect the PBM’s net income (total revenues minus total costs) because pass-through payments represent money exchanged between the insurer and the pharmacy, with the PBM serving as the intermediary. However, by recording pass-through payments as revenues and expenses under the principal model, the PBM’s profit margin (net income divided by total revenues) appears almost an order of magnitude lower—only 9.4% in comparison with 82.7% under the agent framework.
4.2. Comparison of Revenue Reporting: Incorporating Manufacturer Rebates
We can extend the previous example by assuming that, in addition to processing claims, PBMs also negotiate rebates between manufacturers and insurers. In this case, the PBM will handle funds passed from manufacturers to insurers and from insurers to pharmacies. Figure 5 incorporates manufacturer rebates and pass-through payments into the conceptual framework and assumptions. In addition to comparing the principal and agent frameworks in the accounting statement (Table 2), we also show how PBMs could use a mix of principal and agent frameworks for reporting manufacturer and pharmacy pass-through payments (“mixed framework”).14 As in the simplified example, how PBMs decide to handle pass-through payments in their financial statements does not affect their net income, but it does change how their profitability will be reported.
Figure 5. Flow of funds for PBM accounting and assumptions with rebate negotiations

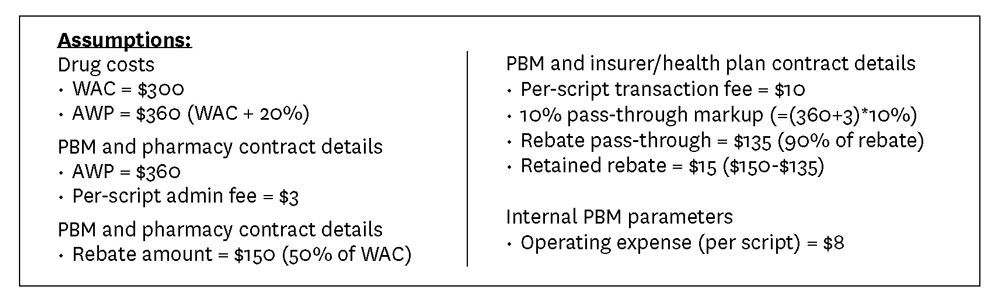
Table 2. PBM accounting statement (corresponds to framework and assumptions in Figure 5)

4.3. Vertical Integration and Impact on the Visibility of PBM Profitability
Our final example demonstrates how vertical consolidation obscures PBM profitability. Following the vertically integrated flow of funds presented in Figure 2, we assume the vertically integrated healthcare conglomerate consists of an insurer/health plan, a PBM that owns a GPO that handles rebates, and a specialty or mail-order pharmacy. Figure 6 presents the PBM revenues and expenses under three accounting perspectives: the principal framework under a horizontal market configuration, the internal financial statement for the PBM segment of a vertically consolidated firm and the external financial statement for the PBM segment of a vertically consolidated firm. For reference, we also provide example financial statements for all internal segments in the appendix, but these are not relevant to demonstrating PBM profitability.
Figure 6. Flow of funds for a vertically integrated healthcare conglomerate and assumptions

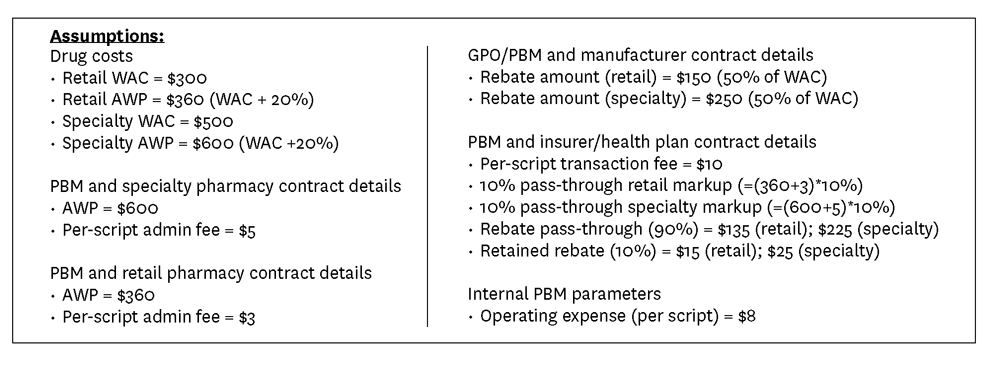
Total revenues, total costs, net income and profit margins for the PBM are identical between the horizontal configuration and vertically consolidated internal reporting. The key difference is that all financial flows between the PBM and the specialty pharmacy and insurer are internal transfers in the vertically integrated firm, whereas they would represent flows between three different firms in a horizontal configuration. Internal transfers are not shown in the external financial statements for the vertically integrated firm, which further understates the PBM segment’s profitability. Finally, it is important to note that, in reality, the PBM will likely not be its own segment but will be grouped with other segments for reporting purposes, which further masks its particular financial flows. For example, in their most recent 10-K filings, CVS and Cigna report that their PBM is contained in the same segment as their specialty and mail-order pharmacies and their care-delivery organizations, and Humana’s PBM is in the same segment as its insurance operations (see Table 5 in the appendix for details on business segments for the four major healthcare conglomerates).[35–37]
Table 3. PBM accounting statement under horizontal and vertically consolidated configurations (corresponds to framework and assumptions in Figure 6)

5. Discussion
This paper demonstrates that relatively low profitability in the PBM industry is potentially an artifact of accounting choices made when compiling public-facing financial statements. Moreover, limited transparency into true PBM profitability has been further masked by widespread vertical consolidation among companies in the pharmaceutical supply chain. Because public financial statements only report aggregated totals for revenues and expenses, policymakers and analysts cannot determine how much PBM cash flow reflects pass-through payments rather than actual earnings. As a result, historically “thin” margins likely reflect accounting conventions rather than true profitability.
From an accounting perspective, we do not offer any judgments regarding the correct approach to accounting for PBMs, but we note one peer-reviewed paper arguing for the agent framework.[19] However, since profit levels are unchanged by how pass-through payments are treated, accounting principles do not affect profitability from an economic perspective. As a result, metrics that rely on profit levels rather than margins will provide an accounting-invariant measure of PBM profitability. To get a better sense of whether individual PBM profits are high or low across the industry, profit levels can be compared against total market revenue. Additionally, wide swings in profit margins caused by changes to accounting rules suggest that reported profit margins may not provide a strong basis for inferences about market power or industry concentration. Our findings also warrant caution when interpreting PBM financial metrics, especially absent more transparent financial reporting regarding funds flowing through PBMs.
To increase transparency in PBMs’ financial reporting, policymakers could mandate PBMs report revenues net of all pass-through payments, which effectively treats PBMs as agents for accounting purposes. Regulators have introduced analogous reporting requirements in other industries to help distinguish principal and agent activity. However, in the case of PBMs, this sort of reform would have a limited impact because many PBMs are shifting to a business model where an increasing share of profits is generated through fees, not pass-through payments such as rebates.[38] Between 2012 and 2020, the share of gross profits generated by rebates decreased from 46% to 14% while the share generated by fees and GPOs increased from 5% to 21%.[26] Beyond fees, PBMs generate expenses and revenue from a range of services that do not involve pass-through payments such as claims processing, formulary management, adherence programs and prior authorization, and therefore would not be affected by changes to accounting requirements. Moreover, in a vertically consolidated setting, PBMs can also direct profit streams by shifting prescriptions to PBM-owned specialty pharmacies.[39] Transparency reforms must therefore address the source of income streams in addition to pass-through accounting.
Beyond the principal/agent classification of revenues, additional reforms might focus on disaggregating reporting by business segment within vertically consolidated health conglomerates. Current reporting requirements permit firms to combine their PBM operations with other segments (e.g., the “pharmacy services” segment might include specialty pharmacy, GPO and PBM), limiting visibility into each component’s financial contribution to profitability. Policymakers could require separate reporting for each unique business function, including disclosure of internal transfers and pass-through payments. This would provide clarity around where profits are generated within the pharmaceutical supply chain, even in an environment with substantial vertical integration. The financial sector provides precedence for disaggregated revenue reporting, where companies must separately report interest income, trading gains and underwriting.[40,41] In addition to improving transparency in financial reporting, disaggregated reporting would allow for direct comparisons of PBM profitability across vertically consolidated firms.15 Rebate payments are often significant items in the financial statements of PBMs and branded pharmaceutical companies, so, in general, the SEC and other regulators may wish to explore the merits and drawbacks of requiring more detail around where and how these cash flows are directed. For example, these details may improve corporate governance and investor oversight. On the other hand, they may also introduce new layers of complexity.
Our paper has focused on a unique PBM accounting issue, yet this represents only one part of the equation for pharmaceutical supply chain dynamics and drug prices. Even if the U.S. adopted the PBM reforms we propose, the role of rebates—which corresponded to $356 billion in price concessions for branded drugs16 in 2024 [43]—in rising drug prices, formulary placement, and manufacturer and middlemen financial outcomes would remain opaque. To better understand the true flow of funds, additional transparency requirements for pharmaceutical companies’ financials is necessary. Beyond providing aggregate rebate totals, firms would need to report details on where rebates are being paid including which organizations are receiving them, on which drugs and so on. This detailed degree of transparency would give policymakers and shareholders better insight into a major element of manufacturers’ business operations and serve to minimize “surprises.”
In general, while we expect additional transparency will lead to more efficient business decisions and provide policymakers with better information to develop effective regulations and policies, it may also lead to worse market outcomes in some cases. For example, detailed reporting of their contractual details by PBMs could lead to tacit collusion and reduce price competition as well as reduce incentives to encourage lower-cost generic drug utilization, further exacerbating growing drug costs.[42] Similarly, full transparency on net drug prices by manufacturers could potentially reduce incentives for innovation, delay access, or disproportionately impact low- and middle-income countries.[44,45] Transparency requirements will also be ineffective if they are not enforced: A recent study found that despite the presence of price transparency requirements for hospitals, 56% of hospitals did not report prices and 66% of hospitals only partially reported prices.[46] Moreover, these transparency reforms may have minimal impact on the drug prices that consumers face.17
PBMs have used their historically low profit margins to minimize scrutiny from the FTC.[3] The sensitivity of these margins to alternative plausible accounting rules weakens the case for drawing inferences about competition from reported margins. Future regulatory investigations and analyses of market power of PBMs should consider the potential role that accounting frameworks and pass-through payments play in profitability.
References
- U.S. Federal Trade Commission. (2024). Pharmacy Benefit Managers: The Powerful Middlemen Inflating Drug Costs and Squeezing Main Street Pharmacies. https://www.ftc.gov/reports/pharmacy-benefit-managers-report.
- Metcalf, T., and N. Weinberg. (2017). Drug Middlemen Have Slim Profit Margins—Just Ask Them. Bloomberg. Apr 3. https://www.bloomberg.com/news/articles/2017-03-31/drug-middlemen-have-slim-profit-margins-just-ask-them.
- Compass Lexecon. (2024). PBMs and Prescription Drug Distribution: An Economic Analysis of Criticisms Levied Against Pharmacy Benefit Managers. https://www.compasslexecon.com/cases/pbms-and-prescription-drug-distribution-an-economic-consideration-of-criticisms-levied-against-pharmacy-benefit-managers.
- Salinger, M. (1990). The Concentration-Margins Relationship Reconsidered. Brookings Papers on Economic Activity Microeconomics. Brookings. https://www.brookings.edu/articles/the-concentration-margins-relationship-reconsidered.
- Shaffer S. (1994). Structure, Conduct, Performance and Welfare. Review of Industrial Organization, 9 (4): 435–50.
- Einav, L., and J. Levin. (2010). Empirical Industrial Organization: A Progress Report. Journal of Economic Perspectives, 24 (2): 145–62.
- Grant, C. (2018). Hidden Profits in the Prescription Drug Supply Chain. Wall Street Journal, Feb 24.
- U.S. Federal Trade Commission. (2025). Specialty Generic Drugs: A Growing Profit Center for Vertically Integrated Pharmacy Benefit Managers. https://www.ftc.gov/reports/specialty-generic-drugs-growing-profit-center-vertically-integrated-pharmacy-benefit-managers.
- House Committee on Oversight and Accountability Staff. (2024). The Role of Pharmacy Benefit Managers in Prescription Drug Markets. https://oversight.house.gov/report/pbm-report.
- Sood, N., T. Shih, K. Van Nuys and D. Goldman. (2017). The Flow of Money Through the Pharmaceutical Supply Chain. Schaeffer. https://schaeffer.usc.edu/research/flow-of-money-through-the-pharmaceutical-distribution-system.
- Mattingly, T. J., D. A. Hyman and G. Bai. (2023). Pharmacy Benefit Managers: History, Business Practices, Economics and Policy. JAMA Health Forum, 4 (11): e233804.
- Mattingly, T. J., K. C. Ben-Umeh, G. Bai and G. F. Anderson. (2023). Pharmacy Benefit Manager Pricing and Spread Pricing for High-Utilization Generic Drugs. JAMA Health Forum, 4 (10): e233660.
- Lalani, H. S., A. S. Kesselheim and B. N. Rome. (2025). Benefits and Limitations of Direct-to-Consumer Pharmacies in the US. JAMA Network Open, 8 (8): e2527484.
- Cantrell, S. A. (2024). It Is Time for a More Nuanced Discussion About Pharmacy Benefit Managers. Journal of Managed Care & Specialty Pharmacy, 30 (12): 1345–8.
- Barlas, S. (2015). Employers and Drugstores Press for PBM Transparency: A Labor Department Advisory Committee Has Recommended Changes. Pharmacy & Therapeutics, 40 (3): 206–8.
- Martin, K. (2025). What Pharmacy Benefit Managers Do, and How They Contribute to Drug Spending. Commonwealth Fund. https://www.commonwealthfund.org/publications/explainer/2025/mar/what-pharmacy-benefit-managers-do-how-they-contribute-drug-spending.
- Frank, R. G. (2024). Richard G. Frank’s Testimony on the Role of Pharmacy Benefit Managers. Brookings. https://www.brookings.edu/articles/richard-g-franks-testimony-on-the-role-of-pharmacy-benefit-managers.
- Fiedler, M., L. Adler and R. G. Frank. (2023). A Brief Look at Current Debates About Pharmacy Benefit Managers. Brookings. https://www.brookings.edu/articles/a-brief-look-at-current-debates-about-pharmacy-benefit-managers/
- McLean, R. A., and R. I. Garis. (2005). Accounting Principles, Revenue Recognition and the Profitability of Pharmacy Benefit Managers. Research in Social and Administrative Pharmacy, 1 (1): 118–25.
- Brot-Goldberg, Z. C., C. Che and B. R. Handel. (2022). Pharmacy Benefit Managers and Vertical Relationships in Drug Supply: State of Current Research. NBER Working Paper 29959. http://www.nber.org/papers/w29959.
- Feng, J., and L. Maini. (2024). Demand Inertia and the Hidden Impact of Pharmacy Benefit Managers. Management Science, 70 (12): 8940–61.
- Ho, K., and R. S. Lee. (2024). Contracting Over Pharmaceutical Formularies and Rebates. NBER Working Paper 32790. https://doi.org/10.3386/w32790.
- Brot, Z., C. Che and B. Handel. (2025). Pharmacy Benefi t Managers and Vertical Relationships in Drug Supply. BFI Working Paper No. 2025-101. https://bfi.uchicago.edu/working-papers/pharmacy-bene%EF%AC%81t-managers-and-vertical-relationships-in-drug-supply.
- Van Nuys, K., G. Joyce, R. Ribero and D. Goldman. (2018). Overpaying for Prescription Drugs: The Copay Clawback Phenomenon. Schaeffer. https://schaeffer.usc.edu/research/overpaying-for-prescription-drugs.
- Mattingly, T. J. II, and G. Bai (2021). Reforming Pharmacy Direct and Indirect Remuneration in the Medicare Part D Program. http://www.healthaffairs.org/do/10.1377/forefront.20210714.70749/full.
- Percher, E. (2023). Trends in Profitability and Compensation of PBMs and PBM Contracting Entities. Nephron Research. https://nephronresearch.com/trends-in-profitability-and-compensation-of-pbms-and-pbm-contracting-entities.
- Becker, C. (2025). This Year’s Prescription Drug Bills Aim to Reduce Consumer Costs. National Conference of State Legislatures. https://www.ncsl.org/state-legislatures-news/details/this-years-prescription-drug-bills-aim-to-reduce-consumer-costs.
- Sood, N., and K. Van Nuys. (2022). The Cantwell-Grassley PBM Bill Is Much Needed but More Can Be Done. Health Affairs Forefront. https://www.healthaffairs.org/content/forefront/cantwell-grassley-pbm-bill-much-needed-but-more-can-done.
- Financial Accounting Standards Board. (2014). Accounting Standards Codification (ASC) Topic 606: Revenue From Contracts With Customers.
- Financial Accounting Standards Board. (2000). EITF Issue No. 99-19: Reporting Revenue Gross as a Principal Versus Net as an Agent.
- Deloitte. (2019). Revenue Recognition: Evaluating Whether an Entity Is Acting as a Principal or as an Agent. https://dart.deloitte.com/USDART/home/publications/archive/deloitte-publications/accounting-spotlight/2019/revenue-recognition-evaluating-whether-an-entity.
- CVS Health Corporation. (2011). Form 10-K: Annual Report for the Fiscal Year Ended December 31, 2010. U.S. Securities and Exchange Commission.
- Financial Standards Accounting Board. (2025). Revenue Recognition.
- Express Scripts Holding Company. (2017). Form 10-K: Annual Report for the Fiscal Year Ended December 31, 2016. U.S. Securities and Exchange Commission.
- CVS Health Corporation. (2025). Form 10-K: Annual Report for the Fiscal Year ended December 31, 2024. U.S. Securities and Exchange Commission.
- The Cigna Group. (2025). Form 10-K: Annual Report for the Fiscal Year Ended December 31, 2024. U.S. Securities and Exchange Commission.
- Humana Inc. (2025). Form 10-K: Annual Report for the Fiscal Year Ended December 31, 2024. U.S. Securities and Exchange Commission.
- Silverman, E. (2018). Never Mind the Rebates: Maybe Behind-the-Scenes Fees Are Boosting Drug Prices. https://www.statnews.com/pharmalot/2018/08/16/rebates-fees-drug-prices.
- Motheral, B. R., and K. A. Fairman. (2020). Changes in PBM Business Practices in 2019: True Innovation or More of the Same? Journal of Managed Care & Specialty Pharmacy, 26 (10): 1325–33.
- Financial Accounting Standards Board. (2014). Accounting Standards Codification (ASC) 606-10-50-5 through 50-6: Revenue from Contracts with Customers — Disclosure.
- Deloitte. (2024). Financial Statement Accounting and Disclosure Topics (in Deloitte’s Roadmap: SEC Comment Letter Considerations, Including Industry Insights). https://dart.deloitte.com/USDART/home/publications/deloitte/additional-deloitte-guidance/roadmap-sec-comment-letter-considerations.
- Danzon, P. M. (2015). Pharmacy Benefit Management: Are Reporting Requirements Pro- or Anticompetitive? International Journal of the Economics of Business, 22 (2): 245–61.
- Fein, A. (2025). Gross-to-Net Bubble Hits $356B in 2024—But Growth Slows to 10-Year Low Drug Channels. https://www.drugchannels.net/2025/07/gross-to-net-bubble-hits-356b-in.html.
- Riccaboni, M., T. Swoboda and W. Van Dyck. (2022). Pharmaceutical Net Price Transparency Across European Markets: Insights From a Multi-agent Simulation Model. Health Policy, 126 (6): 534–40.
- Kyle, M. K., and D. B. Ridley. (2007). Would Greater Transparency and Uniformity of Health Care Prices Benefit Poor Patients? Health Affairs, 26 (5): 1384–91.
- Mead, M., and A. M. Ibrahim. (2024). Over- and Underreporting of Prices: Most Hospitals Are Not Compliant With the Hospital Price Transparency Rule. Health Affairs Scholar, 2 (9): qxae099.
- UnitedHealth Group. (2025). Form 10-K: Annual Report for the Fiscal Year Ended December 31, 2024. U.S. Securities and Exchange Commission.
Footnotes
- Measured by total claims processed.
- Given the degree of vertical consolidation between PBMs and insurers/pharmacies since 2017, it has become more difficult to discern PBM profit margins.
- While our paper’s scope narrowly focuses on the interaction between accounting principles and PBM profitability, there is a growing economic literature related to PBMs that may be of interest to some readers. A working paper by Brot-Goldberg et al. (2022) provides a good summary of the economic research.[20] More recent work has used economic models to explore whether PBMs affect drug prices and spending [21,22] and the role of vertical integration on drug access.[23]
- We point readers who are interested in a full depiction of financial flows, product flows and contractual arrangements to Drug Channels.
- DIRs usually occur in Medicare Part D plans and are any fee or payment adjustment between pharmacies and PBMs that occurs after the point of sale.[25]
- In Section 4, we expand this framework to incorporate other PBM functions such as negotiating rebates as well as the impact of vertical integration. The functionality of PBMs in our simplified framework corresponds to PBMs in their earliest form, which served to process drug claims.[11]
- It is worth noting that the role of spread pricing as a contributor to PBM profits has declined since 2016 [26]. This may reflect the proliferation of state-level legislation to prohibit the use of spread pricing in Medicaid and state-regulated plans.[27]
- From EITF 99-19: “The Task Force reached a consensus that whether a company should recognize revenue based on (a) the gross amount … or (b) the net amount … is a matter of judgment that depends on the relevant facts and circumstances and that the factors or indicators set forth below should be considered in that evaluation. The Task Force reached a consensus that none of the indicators should be considered presumptive or determinative; however, the relative strength of each indicator should be considered.”[30]
- In the case where a PBM is fully integrated with both the insurer and pharmacy, this justification for using a principal approach becomes weaker, since the reimbursements correspond to within-company transfers.
- The effective date for ASC 606 was for reporting periods beginning after December 15, 2017, for publicly traded companies and after December 15, 2018, for nonprofits and private companies.[33]
- Control refers to the ability to direct the use of a good or service and obtain substantially all of its benefits before transfer to the customer.
- In its 2010 annual 10-K report, CVS noted that it determines whether it is the principal or agent for its retail pharmacy network transactions on a contract-by-contract basis and have determined that it is the principal in the majority of its contracts.[32] It is possible that other PBMs have either relied solely on an agent framework or used a mix of principal and agent accounting over time, but a systematic review of all historic annual 10-K filings is outside the scope of this paper. Table 4 in the appendix provides details related to revenue recognition as reported by four large healthcare conglomerates in their 10-K annual filings for 2024.
- While we do not consider an example with DIR payments, this extension would modify the payments from the example with rebates.
- To simplify the exposition, we log the collected rebates from the manufacturer as PBM revenues and the rebate pass-through payments to the insurer as expenses. However, in reality, firms may record the values differently in their financial statements. For example, the footnotes of Express Scripts’ 2016 financial statements mention that “rebates and administrative fees earned for the administration of this [rebate] program, performed in conjunction with claims processing and home delivery services provided to clients, are recorded as a reduction of cost of revenues and the portion of the rebate and administrative fees payable to customers is treated as a reduction of revenues.”[34]
- We should be cautious using disaggregated reporting to compare vertically integrated PBMs with stand-alone ones since internal transfer prices within a vertically consolidated firm might not be reflective of the “true” commercial prices faced by stand-alone PBMs.[42]
- The figure is the gross-to-net bubble, which is the gap between list and net prices.
- We are unaware of research that links transparency to drug prices. This is a potential area for future work.


